Introduction
 Profitability can be defined as income minus
expenses. Income over feed costs focuses on milk yield (income) and feed costs (expenses).
Maximum milk yield is not always most profitable, but nutrient costs for maintenance are the
same if cows produce 20 or 40 kg of milk. Generally, higher producing cows will increase profits,
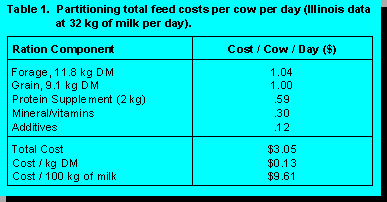
but at a diminishing rate. Partitioning feed costs is one approach to evaluate feed component costs
(Table 1). Dairy managers should compare their partitioned feed costs to herds in their area and at
similar levels of milk production.
Profitability can be defined as income minus
expenses. Income over feed costs focuses on milk yield (income) and feed costs (expenses).
Maximum milk yield is not always most profitable, but nutrient costs for maintenance are the
same if cows produce 20 or 40 kg of milk. Generally, higher producing cows will increase profits,
but at a diminishing rate. Partitioning feed costs is one approach to evaluate feed component costs
(Table 1). Dairy managers should compare their partitioned feed costs to herds in their area and at
similar levels of milk production.Additional feeding comparisons are:
This paper will discuss areas which are important in identifying feeding factors which limit profitability.
Optimizing Dry Matter Intake
Dry matter intake guidelines are outlined below which illustrate factors that impact intake and management.
 consume 1.2% of the body weight as total NDF or 0.9% of
body weight as forage NDF. For example, 600 kg cow times .012 total NDF equals 7.2 kg NDF
intake (forage and grain). Forage intake for a 600 kg cow would be 5.4 kg (600 kg X .009) based
on forage NDF.
consume 1.2% of the body weight as total NDF or 0.9% of
body weight as forage NDF. For example, 600 kg cow times .012 total NDF equals 7.2 kg NDF
intake (forage and grain). Forage intake for a 600 kg cow would be 5.4 kg (600 kg X .009) based
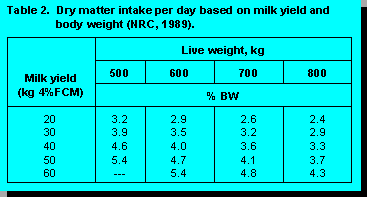
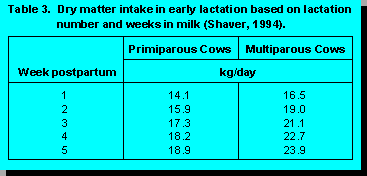
on forage NDF.Wisconsin researchers have identified three factors that limit feed intake and must be managed to optimize DMI. These are listed in Tables 2 and 3.
Physical Fill Factors Which Limits the Cow From Eating More DM. High levels of fiber, feed with high fill factors, slower rates of digesta flow, and long fiber sources can cause the cow to stop eating. Review ADF, NDF, lignin, and functional NDF values to evaluate if a fill factor limitation exists.
Elevated Blood Metabolites Can "Signal" the Brain Satiety Center to Stop Eating. Chemical signals could include blood ammonia or other nitrogen compounds, circulating fat or non-esterified fatty acids, blood pH, or VFA profiles absorbed from the rumen.
The Environment and Bunk Management Can Cause the Cow to Stop Eating Independently of Ration Characteristics. Examples include empty bunk syndrome, moldy feed, secondary bunk fermentation, poor cow comfort, leg problems that limit cow movement, heat and cold stress, and bunk design.
 When rations exceed 50% moisture,
DMI can decline. This effect applies to fermented feeds, not pasture or green chop. Cornell
workers suggest a decline of .02 percentage units DMI as a percent of body weight per one
percentage unit increase in ration moisture. A 635 kg cow fed a ration 10 units wetter may
consume 1.3 kg less DMI due to moisture. Israeli researchers in three experiments reported DMI
was six to nine percent higher with drier rations (38% DM) compared to wetter rations (53%
DM). Adding a dry ingredient such as chopped hay, dry corn, beet pulp, or a buffer can increase
DMI. Maryland workers reported adding buffer to corn silage prior to feeding increased silage pH
and DMI, with an ideal ration pH of 5.5. Moisture content per se is not the primary factor
limiting intake. Fermented products produced during the ensiling process (pH, soluble
nitrogen products, or VFA); intracellular water low in pH; or a localized environment low in
pH which may cause fiber digesting bacteria not to attach and digest forage fiber have
been implicated as causative factors in feed intake depression. Rations can also be too
dry which can lower feed intake because feeds are dusty, fines can separate, cows prefer
acidic feeds, palatability is reduced, or bunk life is shortened. Optimum ration DM
appears to be 55 to 65% DM. Cows appear to be able to eat 50 kg of wet feed a day (at
milk yields of 40 kg of milk).
Israeli workers proposed grouping cows receiving TMR based on DMI, days in lactation, and milk yield potential. In the initial 45 days postpartum, cows are challenged to reach true potential by consuming the high group TMR. Mature cows over 38 kg remain in the high group until they dry off or become fat. Mature cows below 38 kg were assigned to a lower quality and cheaper TMR and remain there until they dry off. Cows were not shifted after 45 days because DMI was significantly reduced which reduced milk yield 2 to 4 kg a day. Differences in DMI (4 to 5 kg per cow per day), energy concentration (1.65 versus 1.76 Mcal per kg of DM), and ration costs result in economic responses.
 Forage quality has a major impact on
milk performance and feed intake. An ideal forage maturity should support maximum
intake, optimum nutrient yield per acre, maintain forage crop stand, and minimize losses.
Missouri workers illustrate the relationship of forage source and maturity to milk yield
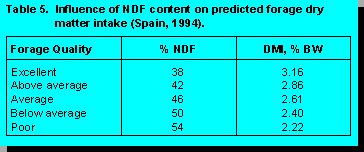
(Table 4). Improved palatability stimulates intake. Wisconsin workers proposed that NDF
content of forage can be used to predict forage DMI (Table 5). Additional amounts of
grain cannot compensate for lower quality forage. Low quality forages result in lower
nutrient content per unit of DM, lower digestibility of the DM, and lower DMI.
Positioning Purchased Feeds
Purchased feeds also include charges for service (forage testing, ration balancing, consulting, and feed quality monitoring). Common questions raised by dairy farmers are:
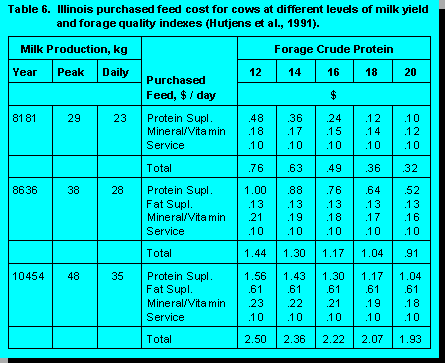
Dairy producers may not purchase enough, excess levels, or the incorrect types of feeds to provide balanced and economical rations. Purchased feeds for lactating dairy cows are affected by two factors: forage quality and level of milk production (Table 6). If forage quality is low, supplemental energy and protein will be needed.
 Feed additives can raise feed costs by 2
cents to 60 cents per cow per day. Table 7 lists several feed additives and strategies for use.
Dairy farmers and nutritionists must correctly position feed additives to economically justify their
use. Benefit to cost ratios can vary from 10:1 (anionic salts) to 8:1 (ionophores and zinc
methionine) to 4:1 (buffers and yeast) to 3:1 (niacin). A survey of high producing US herds in
1991 and 1983 illustrate additive use and trends.
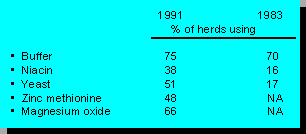
Feed additives can raise feed costs by 2
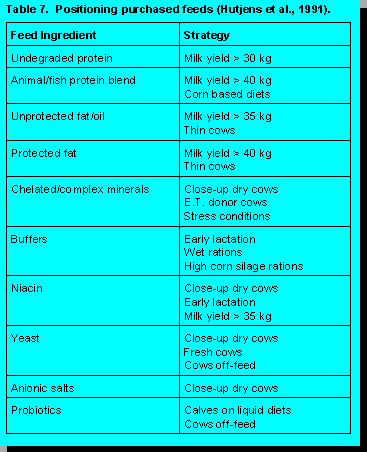
cents to 60 cents per cow per day. Table 7 lists several feed additives and strategies for use.
Dairy farmers and nutritionists must correctly position feed additives to economically justify their
use. Benefit to cost ratios can vary from 10:1 (anionic salts) to 8:1 (ionophores and zinc
methionine) to 4:1 (buffers and yeast) to 3:1 (niacin). A survey of high producing US herds in
1991 and 1983 illustrate additive use and trends.Additive inclusion should be based on its role in the ration, economic response, research support; and ability to measure and evaluate on the individual farm.
There is no "free" time or service. Mathematics become more interesting if you calculate 150 cow herd size at 10 cents per day. Services include forage testing, computer time, educational meetings, mileage and expenses incurred travelling to the farm, and expected time committed; i.e. one-half day per month, phone calls at night, and response to emergencies. An effective service representative could increase milk yield 2 kg per cow (worth 36 cents per day) and/or lower feed costs 20 cents per day at a cost of 10 cents per day (6 to 1 benefit to cost ratio).
References