![]()
Dairy producers through their provincial and federal marketing agencies have long invested in activities to assist in the goal of profit maximization. Producers have been levied to cover the costs of activities such as advertising and promotion as well as production research. Provincial marketing agencies across the country have focused on advertising and promoting fluid milk while the Dairy Bureau of Canada (now Dairy Farmers of Canada) has been charged with advertising and promoting industrial milk products (largely butter and cheese). All milk marketing agencies have contributed to production research, although to a much lower degree than advertising. For example, the Ontario Milk Marketing Board (OMMB) spent $12,869,519 on fluid milk promotion programs (including market research) in 1994 and contributed $9,917,823 to the Dairy Bureau of Canada for industrial milk product promotion. At the same time the OMMB spent $164,063 on research in 1994, plus $132,624 on a Dairy Science Research Chair, and $50,455 on scholarships for graduate student research. They also distributed $395,953 in grants to dairy farmers, Ontario Farm Animal Council, etc. This is not to suggest that research is not being conducted on the dairy production industry. In fact the bulk of the expenditure has been undertaken by various levels of government organizations. Previous researchers (8) have quantified research expenditures of $13 million dollars for the calendar year 1985.
Conceptually producer groups may have operated rationally in the past. From an economic perspective the demand elasticity faced by an industry determines the distribution of benefits from research. The more inelastic the demand the greater the consumer benefit, and the lower the producer benefit from an investment that lowers costs of production and moves the supply curve to the right. With isolated domestic markets for supply managed products, demand elasticities faced are much more inelastic than for commodities such as beef or pork where the effective demand elasticity is the international market (given that Canada is a small country). These conceptual results are borne out by the previous empirical results (8) which suggested negative producer implications from research investment in the dairy industry over much of the analyzed period (1972 to 1985). On the other hand the previous research also shows positive and large producer benefits in industries such as beef and pork where Canada is a small net exporter/importer on world markets.
The question facing dairy producers is the relative return on investment from different investments now and in the future when further trade liberalization will take effect. Although previous patterns of investment may have been appropriate in the past, trade liberalization and domestic market adjustments may call for new directions. The purpose of this paper is to develop a framework for examining producer implications of different industry investment alternatives. An econometric model of the Canadian dairy industry will provide the foundation for the analysis. Of paramount importance will be the quantification of the link between advertising expenditure and disappearance of various advertised dairy products (fluid milk, butter, cheese, etc.) and quantification of the link between marginal costs of production and research expenditure. Simulations will be conducted with the econometric model to illustrate the return on investment possible for additional dollars invested in each advertising activity or in research under existing market regulatory structures.
Conceptual Framework
Market structure can also affect the decision to invest in R&D, although it is not clear whether perfectly competitive industries are more conducive to R&D than monopolies. Arguments have been made in favour of both theories (18). A firm investing in R&D may not necessarily obtain any positive results for some time. Once the research is successful, if a firm does not have some market power or means to protect its investment in the new technology, other firms will be able to copy it at much lower cost removing the firm's opportunity to recoup its expenditure on the R&D and to earn some rate of return on the investment. One argument in favour of patents is that with their protection firms would engage in more R&D (18).
Dorfman and Steiner (6) developed an optimal investment rule for advertising for a monopolist with a fixed quantity of product available for sale. The rule was developed from the first order conditions of profit maximization where profit equals revenues less variable costs of production less fixed costs. Advertising expenditures are treated as a shift parameter in the consumer demand equation such that an increase in advertising expenditure shifts the demand out to the right. Investment in advertising does not affect the costs of production, but is considered a fixed cost. The profit maximization problem is presented in detail in Appendix 1.
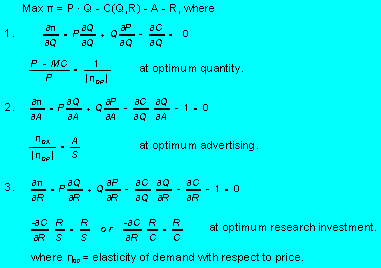
 If the monopolist optimizes
simultaneously with respect to quantity, advertising, and research investment, the optimal
advertising rule and the optimal research investment rule remains the same as they were
in the fixed quantity case. However, the level of investment would likely be significantly
different.
If the monopolist optimizes
simultaneously with respect to quantity, advertising, and research investment, the optimal
advertising rule and the optimal research investment rule remains the same as they were
in the fixed quantity case. However, the level of investment would likely be significantly
different.
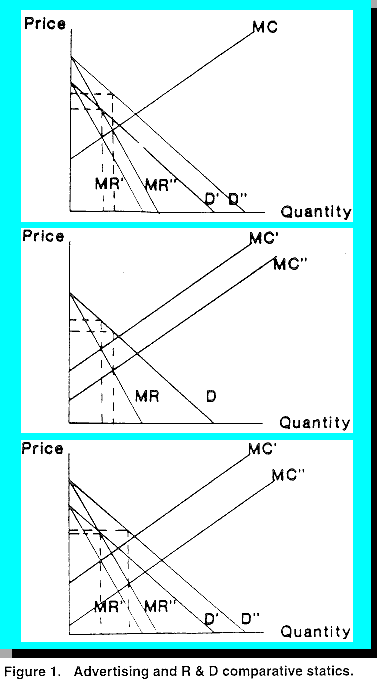
Figure 1 depicts three comparative static graphs. The first shows the shift in demand and marginal revenue that result from an increase in advertising expenditure. The second shows the shift of the marginal cost curve that would result from investment in R&D. Finally, the third graph shows both demand and marginal cost shifting as a result of expenditure on both advertising and R&D. For the first graph, an increase in advertising clearly results in both higher price and quantity. An increase in R&D as depicted in the second graph results in an increase in quantity and a decrease in price. For the third graph, the effects of an increase in both advertising and R&D expenditure are uncertain. There is a clear increase in quantity, while the net effect on price depends upon the magnitude of the supply and demand shifts. It could either increase or decrease.
The question of whether it is appropriate or not to characterize the milk industry as a monopolist arises with the advent of trade liberalization. For at least the first six years of the new trade agreement much control of the domestic milk industry is still left in the industry's hands due to the high level of proposed tariffs and only gradual erosion of those tariffs. It is clear that control is not quite as rigid as in the past since the volume of imports is higher.
Model Structure
The decision making process in the sectors of the CDI given the regulatory policies are dealt with here, first to provide a theoretical basis of the decision taken, and then the specification of the behavioral equations that characterize each sector. Technical relationships and identities close the model.
The Producers' Sector
Raw milk supply is regulated by using quota to limit farm shipments of both fluid and industrial milk in Canada. In particular, provincial marketing boards who are directly responsible for the implementation of both fluid and industrial milk policies practice a form of price discrimination when they sell raw milk to processors.
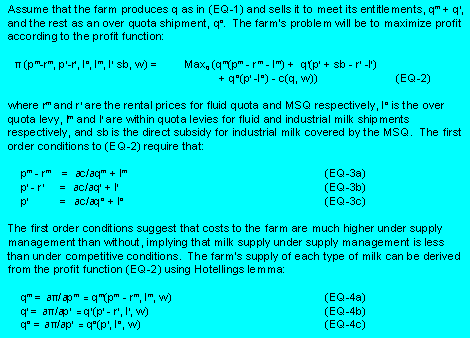
The result of regulating milk supply is that the standard supply function for a firm in a competitive market, that economic theory postulates, cannot be observed. Moschini (17), however, has shown that a supply function for a commodity under supply management can be estimated if quotas can be freely traded, since the rental price of quota is simply the difference between output price and marginal cost. Marketing boards collect levies from producers for market expansion programs and other activities necessary for the maintenance of supply management. They also charge an over-quota levy to discourage shipments of industrial milk over a producer's allotment of MSQ. Producers receive a direct per unit output subsidy for their industrial milk shipment equal to their MSQ allotment, and none for industrial milk shipment over their entitlements. There is no subsidy for fluid milk shipments. Given the above information a milk producer's supply decision can be formulated. See Appendix 2 for detailed discussion.
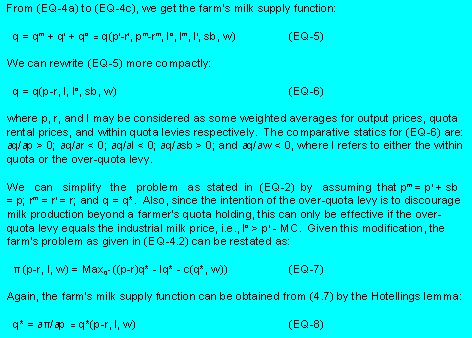
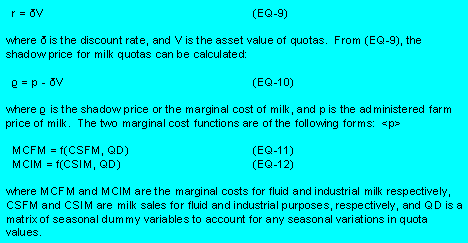
The supply functions for fluid and industrial milk as given in (EQ-4a) and (EQ-4b) as well as the total farm milk supply as given in (EQ-6) and (EQ-8) are almost ready for estimation. The main issue to be resolved to permit the estimation of these supply functions has to do with the rental prices for quotas which are usually not observable since quotas are traded as capital assets. Two approaches are suggested by Moschini to (17) resolve this problem. One is to estimate a marginal cost function, and the other is to find an estimate of the rental price of quota. The former has the advantage in that we do not need any information on quota rental price, but has the disadvantage of having to consider such issues as risk and the techniques required to recover supply from the marginal cost function. The only problem with the latter is that one has to choose an appropriate discount rate to estimate rental prices for quotas using information on asset value of quotas. This study will employ the latter approach where estimates of quota rental prices will be obtained and used in estimating farm supply of raw milk.
One peculiarity about the Canadian dairy policy is that the quota value for fluid milk is different from the quota value for industrial milk. As a result, two marginal cost equations will be estimated to endogenize the quota values for each type of milk quota. For this estimation to be made, it is necessary that we obtain some estimates of the shadow prices for both types of milk. This is accomplished by employing the method suggested by Moschini (17) which is described in Appendix 3.
Shadow prices are obtained by getting an estimate of the rental value of quotas using the information on asset values of quotas. Once an estimate of rental value of quotas is established, we can then obtain shadow prices for fluid and industrial milk by deducting estimated rental values from the administered prices.
In general, research expenditures can be viewed as the source of technological change that shifts the supply function down and to the right (8). The supply function is estimated directly as a function of research expenditure to facilitate the estimation of returns to research at the margin. Research expenditure (proportioned into industrial and fluid milk shares by milk production shares) will be incorporated as a lagged variable into each marginal cost equation. The expected relationship would be negative. As research expenditure shifts the supply equation, the marginal cost of producing milk declines.
In a perfect world total milk production should equal the total quota in the system. The presence of the over-quota levy suggests that there may be a tendency for farmers to ship more than their allotments. This is because milk shipments above a farmer's allotment can end up qualifying for government payment if these are used to cover someone else's shortfall. The incentive is there to ship more to take advantage of potential opportunities. In fact, statistics show that only twice did actual production of industrial milk fall below the established MSQ level since the 1976/1977 dairy year, but it was more than the established requirements in all the other years (Ind. Sc. and Tech. Canada 1990-1991; 3).
As well, not all of a farmer's shipment for fluid milk will necessarily be used as fluid, this will depend on demand at the time. As a result, some of a farmer's fluid shipment will be used for industrial milk. Only the portion of fluid milk shipment that was used in the fluid market will receive the premium price, the rest will receive the industrial milk blend price. The proportion of the fluid shipment that was actually used in the fluid market is the payout percentage. Given the payout percentage and exclusion factors, aggregate milk shipments in the country never equate to the total quota in the country. In aggregate, the actual decision by the farmer to produce and supply milk can vary according to the following functional relation:
where TFMP is total farm milk production, TQSY is total quota in the system, PAOP is the payout percentage, PGAP is the difference between the class 1 milk farm price and the blend price plus federal subsidy, and OQLV is the over quota levy.
Processors' Sector
Domestic milk processors obtain all the milk they use in the manufacture of various milk products from provincial milk marketing boards. Besides raw milk, they also employ other inputs such as labour and capital in the production of manufactured milk products. While marketing boards determine milk prices based on costs of production, the final price that processors pay for raw milk are the result of some negotiations between processors and marketing boards.
Even though the supply of raw milk is restricted by marketing boards, processors normally obtain all the milk they need at the established prices. The exception may be for producers of butter and skim milk powder, who receive whatever milk is left after the demands by producers of other products are satisfied. This is also unlikely if milk producers would like to extract all the profits they can get from the market. This means that raw milk cannot be treated as a fixed input by processors, despite the fact that supply from the farm is restricted. This information is useful in the derivation of processor' demand for milk. Fixed inputs impose a constraint on production, and therefore can be entered as explanatory variables in processors' input demands instead of their prices. The processor's demand for raw milk as derived here follows the procedure described in Beattie and Taylor (1) and is described in detail in Appendix 4.
The theoretical construct of a dairy processing firm's behavior given in Appendix 4
provides a very straight forward and simple suggestion on the type of information that we
can include in such a firm's input demand and output supply functions. However for the
CDI, things are not as straight forward as theory suggests. For instance, the amount of
skimmed-off cream from fluid milk production continues to increase, and is a major
consideration in butter production, as well as the build up of butter stocks that the CDI
cannot dispose of. Stocks of milk powder, concentrated milk, butter, and others that can
be reconstituted to make soft products, or to fortify products like cheeses, have to be
considered when the level of MSQ is evaluated. These factors and likely retail prices are,
perhaps, more important in determining a firm's demand for milk used in finished dairy
products than the farm price of milk.
Given the prevailing conditions in the CDI as discussed above and the theoretical postulates of economic theory, dairy processors' demands for raw milk will have the form outlined in Appendix 5.
Processors' milk demand for fluid milk is written as a function of farm and retail price of milk, the price of other inputs, and seasonal variations. In a similar manner, milk demand for fluid cream is said to depend of the blend price of industrial milk, the retail price of cream, the price of other inputs, and seasonal variations. Processors' milk demand for cheddar cheese production depends on stocks of cheese products, stocks of skim milk powder, the retail price of cheddar cheese, the blend price of industrial milk, a trend variable to account for technological change, the price of other inputs, and seasonal variations in processor's demand. Milk demand for other cheeses is written as a function of stocks of cheese products, stocks of skim milk powder, the blend price of industrial milk, retail price of other cheeses, the price of other inputs, a time trend, and seasonal variations. Ice cream and other soft products can use reconstituted milk, and some of the skimmed-off cream from fluid production are used here. This allows us to write the processors' milk demand for soft products as a function of stocks of skim milk powder, the level of fluid milk production, the blend price for industrial milk, the retail price of soft products, the price of other inputs, a time trend, and seasonality in processors' demand. Processors' milk demand for concentrated milk is a function of net stocks of concentrated milk products, the blend price of industrial milk, the retail price of concentrated milk, the price of other inputs, a time trend variable, and seasonal changes in processor's demand. Finally, residual industrial milk after satisfying the requirements of "priority" products, is used to make butter. The skim milk that comes out of butter production is dried to skim milk powder. The same is done to skim milk from fluid cream production. See Appendix 6 for additional detail.
Consumers' Sector
Consumer's demands for dairy products are derived using the conceptual framework provided by economic theory. For details see Appendix 7.
As suggested in EQ-38 and EQ-39, the main postulate of consumer theory is that demand is a function of prices and disposable income. In practice, however, economists often include factors like demographic variables, seasonal variation, time, and advertising that experience shows can affect consumer choice, often in an ad hoc manner.
A number of researchers have attempted to provide theoretical justification for including variables other than prices and disposable income in demand equations. For advertising, the most appealing approach of incorporating it into the utility function proposes that advertising could be entered directly into the utility function as an augmenting variable, in a manner similar to how technology has been treated in production theory (5, 7, 13, 19, 21, 24). Work on demographic variables have been attempted by others including Polak and Wales (20) and Lewbel (15). Demand analysis in this study will consider retail prices, disposable income, advertising expenditures, habit persistence, demographic variables, seasonality, and trend in consumer's preferences.
The specification of consumer's demands for dairy products follows the two-stage budgeting approach described in Deaton and Muellbauer (4) and others. Two-stage budgeting approach assumes that the consumer allocates his budget, first to broad groups; then second, the group budget is allocated to individual commodities.
There are two crucial assumptions for the two-stage approach to be workable. The first requires that the utility derived from the consumption of goods in one group is not affected by the consumption of goods in another group. Technically speaking, this means that the marginal rate of substitution between any two commodities within any given group is independent of a commodity in any other group. The second condition requires that the allocation at both stages be consistent.
The two-stage budgeting has several appealing characteristics. For one, it makes an otherwise unmanageable problem, manageable. Economic theory requires that prices of all goods that the consumer purchases should enter the demand equation. Attempts to circumvent the problem include the use of composite goods and reducing the time periodicity, but results were often unsatisfactory. Policy makers often need more detailed information than what aggregates can provide, and it is often frustrating to try and break down annual data to monthly or quarterly data unless some very strong assumptions about the data are made. Also, since the result of the two-stage budgeting approach is an estimation of a system of equations for related commodities, more in a manner one would estimate the whole system of all commodities if data were not a problem, the properties of demand functions as stipulated by economic theory are easily satisfied. But more important for studies like this, is that cross effects can be easily accounted for.
A single equation in the log-log form will be used to estimate total expenditures on milk and dairy products, and the translog demand system developed by Christensen, Jorgenson and Lau (2) is used to estimate an expenditure share system for dairy products in Canada. The nine milk and dairy commodities described in the previous section make up the nine commodities in the translog expenditure share system. The specification of the consumer's demand is as described in Appendix 8.
Summary of Model Specification
The equations in the appendices provide the conceptual framework that is needed for the analytical work that this study requires. The usual framework provided by economic theory was modified where needed to accommodate the various institutional arrangements in the CDI.
The CDI model developed in this chapter divides the industry into four blocks. The first is the government who decides on how much milk dairy farmers can produce each period. The second represents the farmers who produce and supply government determined milk to milk processors. The third represents the processors who convert raw milk into finished dairy products; and finally, the consumers who demand these commodities. All these sectors are linked by technical relationships and identities.
Overall, the structure of the CDI model is made up of thirteen behavioral equations where one is a demand system, thirty five identities and seven technical relationships.
This complete model when estimated can be used to characterize the dairy industry and provide a basis for "what if" analysis of increases in advertising or research expenditure.
Model Simulation Results
The complete econometric model of the CDI has eight-eight endogenous variables and eight-eight equations or identities (one problem existed in the base model so that the retail price of concentrated milk is held exogenous in the simulations to follow). The model endogenizes the determination of retail dairy product prices, retail dairy product consumption, farm level prices of milk by end use, use of milk by end product, cost of production prices for fluid and industrial milk, static (rental) quota values for fluid and industrial milk, and farm level "profits" for the entire Canadian milk sector. Profits in this context are defined as revenue (fluid milk sales x Class I price for fluid milk plus industrial milk sales x Blend price for industrial milk) adjusted for variable costs of production. Profits can also be considered returns to fixed factors of production including quotas.
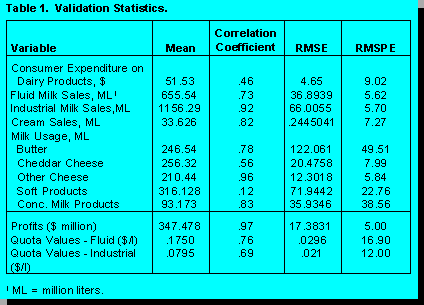 The complete model is simulated over
the period 1984-1994 (first quarter). Model validation and simulation statistics are
summarized for twelve key variables. Validation statistics (to determine how well the
complete model explains the market over the period 1984-1994) are provided in Table 1.
The correlation coefficients (actual and simulated) suggest that with the exception of milk
used in soft products and to a lesser extent consumer expenditure on dairy products the
simulated data track actual data relatively closely. The biggest Root Mean Squared
Percentage Errors are in milk used in butter (a residual variable) and in soft and
concentrated milk product production. Profits for the industry track very closely as do
quota values and industrial and fluid milk sales. The model is satisfactory for retrospective
policy analysis purposes.
The complete model is simulated over
the period 1984-1994 (first quarter). Model validation and simulation statistics are
summarized for twelve key variables. Validation statistics (to determine how well the
complete model explains the market over the period 1984-1994) are provided in Table 1.
The correlation coefficients (actual and simulated) suggest that with the exception of milk
used in soft products and to a lesser extent consumer expenditure on dairy products the
simulated data track actual data relatively closely. The biggest Root Mean Squared
Percentage Errors are in milk used in butter (a residual variable) and in soft and
concentrated milk product production. Profits for the industry track very closely as do
quota values and industrial and fluid milk sales. The model is satisfactory for retrospective
policy analysis purposes.
The purpose of the following simulation analysis is to examine what would have happened in the dairy industry over the period 1984-1994 if advertising and research investments had been different. In the dairy industry advertising investments can have two major effects. The first is that consumption of the advertised product will increase. As consumption increases (particularly for fluid milk) milk usage across products can change (as can net stocks of storable products). Over time increases in payout percentage can lead to slight increases in total milk production. These changes will lead to changes in profits and quota values in the industry. The second change is directly to the administered cost of production price which incorporates advertising levies directly. Research investments (previously assumed to be represented by government expenditure) can operate directly on marginal, total, and average costs of production in the dairy industry. These changes will affect the administered cost of production prices leading to changes in retail product pricing, dairy product consumption, and ultimately milk usage across product. The question for the dairy industry is which investment would have netted a bigger return on investment.
The results of the simulations depend critically on the empirically estimated responses to
individual product advertising investment and research investment captured by the
regression coefficients of the estimated models. In economic terms these response
measures are usually summarized as elasticities (percentage change in dependent
variable given a one percent change in independent variable). The advertising and
research elasticities generated in this model as compared to those estimated in earlier
research are presented in Table 2. 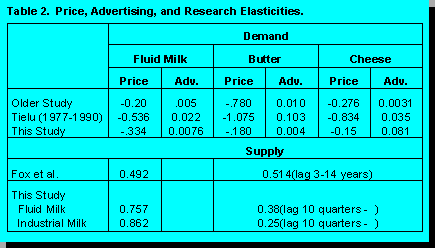 The advertising elasticities are only presented for the
products advertised by the industry, generically. In general, demand in this sample is
more price elastic for fluid milk and less price elastic for butter and cheddar cheese than
earlier studies. Advertising responses are smaller for fluid milk and butter, but larger for
cheddar cheese than in the earlier study. Supply elasticities are larger in this than the
earlier studies, but research elasticities are slightly smaller. Another way of showing how
the industry responds to investments in advertising and research is to simulate the
econometric model with higher advertising or research investment in one period.
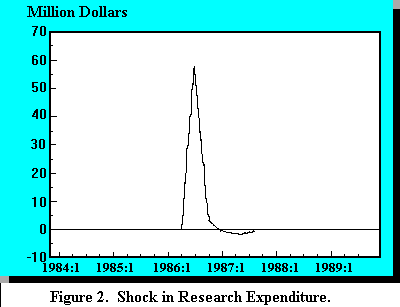
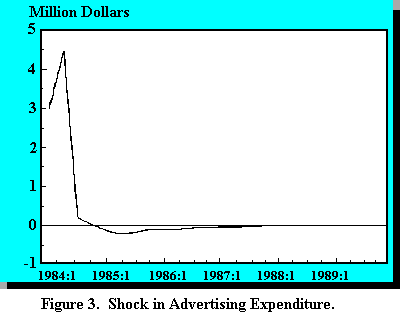
Accordingly research investment and advertising investment were each shocked in the
first quarter of 1984. Time paths of adjustment in industry profit are graphed in Figures 2
and 3. The increase in research expenditure in the first quarter of 1984 does not affect
the market until mid-way through 1986. At that time profits increase sharply and decline
almost as quickly, returning to base levels by 1989. The advertising shock (butter and
cheese advertising) increases profits in the quarter of the investment, falls off again
quickly and returns to base values by mid-1988. Earlier studies suggested longer phase
out periods for research investment, but similar initial lagged responses. The pattern of
response to advertising expenditure is similar to that achieved in earlier studies.
The advertising elasticities are only presented for the
products advertised by the industry, generically. In general, demand in this sample is
more price elastic for fluid milk and less price elastic for butter and cheddar cheese than
earlier studies. Advertising responses are smaller for fluid milk and butter, but larger for
cheddar cheese than in the earlier study. Supply elasticities are larger in this than the
earlier studies, but research elasticities are slightly smaller. Another way of showing how
the industry responds to investments in advertising and research is to simulate the
econometric model with higher advertising or research investment in one period.
Accordingly research investment and advertising investment were each shocked in the
first quarter of 1984. Time paths of adjustment in industry profit are graphed in Figures 2
and 3. The increase in research expenditure in the first quarter of 1984 does not affect
the market until mid-way through 1986. At that time profits increase sharply and decline
almost as quickly, returning to base levels by 1989. The advertising shock (butter and
cheese advertising) increases profits in the quarter of the investment, falls off again
quickly and returns to base values by mid-1988. Earlier studies suggested longer phase
out periods for research investment, but similar initial lagged responses. The pattern of
response to advertising expenditure is similar to that achieved in earlier studies.
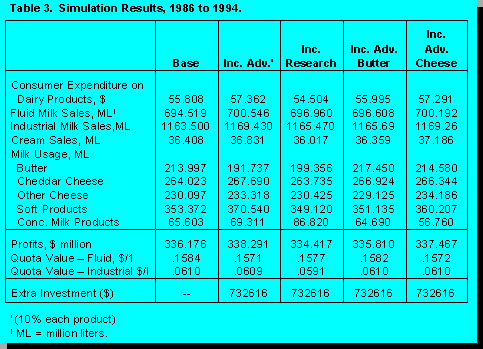 The results in
terms of changes in profits for the dairy industry are outlined in Figure 4. The numbers in
Table 3 and Figure 4 suggest that overall advertising expenditure increases would have
generated higher profits for the industry although butter advertising does not have as big a
payoff as would fluid milk or cheddar cheese advertising. The impact of increased
research expenditure (with the dairy industry now bearing the additional research costs)
was less positive. This scenario is entirely possible in a highly regulated market where
consumer demand is inelastic across all dairy products. As research lowers marginal
costs of production average costs and farm cost of production prices decline. With falling
prices and small changes in quantity demanded producer profits must necessarily
decline.
The results in
terms of changes in profits for the dairy industry are outlined in Figure 4. The numbers in
Table 3 and Figure 4 suggest that overall advertising expenditure increases would have
generated higher profits for the industry although butter advertising does not have as big a
payoff as would fluid milk or cheddar cheese advertising. The impact of increased
research expenditure (with the dairy industry now bearing the additional research costs)
was less positive. This scenario is entirely possible in a highly regulated market where
consumer demand is inelastic across all dairy products. As research lowers marginal
costs of production average costs and farm cost of production prices decline. With falling
prices and small changes in quantity demanded producer profits must necessarily
decline.The scenarios presented are those comparing to the status quo in our highly regulated, restricted import market. Given that Canada faces trade liberalization with the signing of the GATT this year it is also worth examining what the implications of advertising and research are when trade is liberalized.
For simplicity sake imports of fluid milk and butter were each increased to represent 1%
of domestic consumption of these products over the period 1986-1994. Results of this
trade liberalization scenario are presented in Table 4.
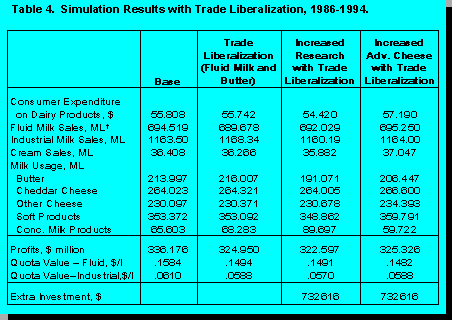 Again, base or status quo figures are
presented for comparison purposes. Model increases in trade in fluid milk and butter
would have resulted in sharply reduced profits for the dairy industry over the past few
years. Prices fall to absorb the additional quantities in the domestic market and with fixed
production quota levels (and production) profits, of necessity, fell.
Again, base or status quo figures are
presented for comparison purposes. Model increases in trade in fluid milk and butter
would have resulted in sharply reduced profits for the dairy industry over the past few
years. Prices fall to absorb the additional quantities in the domestic market and with fixed
production quota levels (and production) profits, of necessity, fell.
To the 'liberalized' market additional research dollars and advertising dollars (of the same magnitude as the previous scenarios) were added. Again it appears that research would have lowered profits further and advertising would have increased profits slightly over the 'liberalized' scenario.

Radical changes in the regulatory structure for the dairy industry (such as those occurring at the present) may reverse the recommendation of best investment strategy for the industry. Similar analysis of the Canadian egg industry (9) suggested that optimal investment strategies for the egg industry would have been to reallocate some of their advertising dollars to applied cost-reducing research programs. That the results differ across industries is a result of the much more inelastic demand for dairy products presented in this study. While table egg demand is inelastic breaker egg demand has been estimated to be very elastic.
It is also worth remembering that this study has focused on farming industry returns from investment in research. Clearly consumers, retailers, and processors all stand to gain from cost reducing research investments to a significant extent and they may not gain at all from advertising investments. Social welfare gains are much higher from research investments than advertising investments.
References
Appendix 1. Profit Maximization.
 The advertising to sales revenue ratio
should equal the ratio of the elasticity of demand with respect to advertising and the elasticity of
demand with respect to price (14).
The advertising to sales revenue ratio
should equal the ratio of the elasticity of demand with respect to advertising and the elasticity of
demand with respect to price (14).
A similar approach can be used to develop an optimal rule for investment in R&D. The
supply curve can be thought of as the monopolist's marginal cost of production curve. If
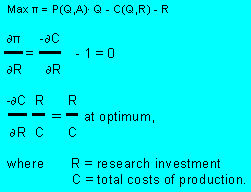 effective, R&D expenditures shift the firm's
cost curve down such that an increase in R&D results in a decrease in the cost of production.
Investment in R&D can also be treated as a fixed cost to the industry.
effective, R&D expenditures shift the firm's
cost curve down such that an increase in R&D results in a decrease in the cost of production.
Investment in R&D can also be treated as a fixed cost to the industry.
For a monopolist, again with fixed quantity of product available for sale optimal investment in R&D can be derived from the first order conditions of profit maximization. The profit maximization problem can be expressed as:
However, the monopolist also has the opportunity to simultaneously optimize quantity, advertising investment, and research investment. In that case the profit maximization problem can be defined as:
where q is milk output and x is the input vector.
Appendix 3. Rental price for quotas.
 Assume that all inputs including milk
are allocatable, and that institutional arrangements ensure that price discrimination
behavior by marketing boards can be enforced. The latter is necessary since milk is
essentially a homogeneous product, and it is profitable for any firm to purchase the lowest
priced milk and use it for the production of high-priced outputs. Since production targets
for each type of product has to be maintained, it is essential that milk sold for each
purpose is used for that purpose alone. Once institutional arrangements that guarantee
the use of milk only for the purpose it is sold for break down, we can no longer operate on
the notion of separated markets with different prices for milk intended for different uses.
The result is a single market for milk and a single price regardless of how the milk is
utilized.
Assume that all inputs including milk
are allocatable, and that institutional arrangements ensure that price discrimination
behavior by marketing boards can be enforced. The latter is necessary since milk is
essentially a homogeneous product, and it is profitable for any firm to purchase the lowest
priced milk and use it for the production of high-priced outputs. Since production targets
for each type of product has to be maintained, it is essential that milk sold for each
purpose is used for that purpose alone. Once institutional arrangements that guarantee
the use of milk only for the purpose it is sold for break down, we can no longer operate on
the notion of separated markets with different prices for milk intended for different uses.
The result is a single market for milk and a single price regardless of how the milk is
utilized.
![]() Given output prices P1 and P2 for the
two dairy products the firm produces, maximum profit is achieved by maximizing the profit
equation: (see equation 14) with respect to the level of inputs employed in the
manufacturing processes. Note that, because of institutional arrangements, we have
different prices, pq1 and pq2, for milk used in the manufacture of different products, even
though milk is a homogeneous product. Other inputs will have a single price, wi,
regardless of how they are used, and zij denotes the level of the ith other input employed
in the production of the jth milk product. Invoking the envelop theorem, we can get a milk
processing firm's demand for raw milk and supply of milk products by means of the
Hotellings lemma:
Given output prices P1 and P2 for the
two dairy products the firm produces, maximum profit is achieved by maximizing the profit
equation: (see equation 14) with respect to the level of inputs employed in the
manufacturing processes. Note that, because of institutional arrangements, we have
different prices, pq1 and pq2, for milk used in the manufacture of different products, even
though milk is a homogeneous product. Other inputs will have a single price, wi,
regardless of how they are used, and zij denotes the level of the ith other input employed
in the production of the jth milk product. Invoking the envelop theorem, we can get a milk
processing firm's demand for raw milk and supply of milk products by means of the
Hotellings lemma: 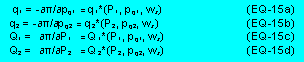
The firm's total demand for milk is the sum of the two milk demands given in equations (EQ-15a) and (EQ-15b), which postulate that a processing firm's demand for raw milk is a function of input and output prices. A processor's demand for milk as in (EQ-15) is assumed to satisfy the homogeneity of degree zero in all prices and symmetry in input prices.
The firm's supplies of milk products are given in equations (EQ-15c) and (EQ-15d), as
functions of output and input prices. Note, that due to institutional arrangements, the firm
does not have the liberty to shift its production from one output to another when there is a
change in prices. The comparative statics for (EQ-15) are: ![]() The first condition ensures that processor's demand for milk in the input quantity-input
price space is downward sloping. The third condition guaranteed that the supply function
for milk products is upward sloping. The processing industry demand for raw milk is
simply the sum of all milk processing firms' demands. By the same token, industry supply
of milk products is the sum of all processing firms' supplies.
The first condition ensures that processor's demand for milk in the input quantity-input
price space is downward sloping. The third condition guaranteed that the supply function
for milk products is upward sloping. The processing industry demand for raw milk is
simply the sum of all milk processing firms' demands. By the same token, industry supply
of milk products is the sum of all processing firms' supplies.
Appendix 5. Dairy processors' demands for raw milk.
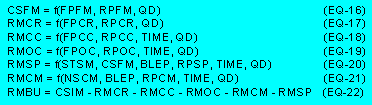 The variables in processors' milk demands are defined as follows: CSFM is milk demand
for the fluid market; RMCR is milk demand for fluid cream; RMCC is milk demand for
cheddar cheese; RMOC is milk demand for other cheese products; RMSP is milk
demand for soft dairy products; RMCM is milk demand for milk for concentrated products;
RMBU is residual industrial milk used in butter production; CSIM is milk available for
industrial purposes; RPFM, RPCR, RPCC, RPOC, RPSP, and RPCM are retail prices
for fluid milk, fluid cream, cheddar cheese, other cheeses, soft products, and
concentrated milk, respectively; NSCM is stocks of concentrated milk; CSFM is fluid milk
production; STSM is stocks of skim milk powder; FPFM, FPCR, FPCC, and FPOC farm
prices of milk intended for fluid milk, cream, cheddar cheese, and other cheese,
respectively; BLEP is the blend price for raw industrial milk; and TIME is a linear time
trend.
The variables in processors' milk demands are defined as follows: CSFM is milk demand
for the fluid market; RMCR is milk demand for fluid cream; RMCC is milk demand for
cheddar cheese; RMOC is milk demand for other cheese products; RMSP is milk
demand for soft dairy products; RMCM is milk demand for milk for concentrated products;
RMBU is residual industrial milk used in butter production; CSIM is milk available for
industrial purposes; RPFM, RPCR, RPCC, RPOC, RPSP, and RPCM are retail prices
for fluid milk, fluid cream, cheddar cheese, other cheeses, soft products, and
concentrated milk, respectively; NSCM is stocks of concentrated milk; CSFM is fluid milk
production; STSM is stocks of skim milk powder; FPFM, FPCR, FPCC, and FPOC farm
prices of milk intended for fluid milk, cream, cheddar cheese, and other cheese,
respectively; BLEP is the blend price for raw industrial milk; and TIME is a linear time
trend.Appendix 6. Processors demand and supply equations.
where TPDM is the processor's total demand for raw milk.
Processed cheese is made from natural cheese and skim milk powder is a by-product of butter and fluid cream production. This means that there is no processors' milk demand for skim powder. Processors, however, require cheese in processed cheese production, and this demand is of the following form:
where CHPC is the quantity of natural cheese used in processed cheese production, RPPC is the retail price of processed cheese, TDNC is total consumer demand of natural cheese, and WPCC is the whole sales price of cheddar cheese.
The CDI has targets for each dairy product, and raw milk is sold to processors on the
basis of end use. To meet industry targets and maintain stability in the industry,
processors are expected to use the milk they purchase for the product it was intended for.
This allows us to establish technical relations between milk demand and the product
produced from milk, eliminating the need to estimate supply for dairy products made from
raw milk. Only the supply function for processed cheese is written as a behavioral
equation, but supplies for all dairy products made from raw milk are written as either
identities or technical relations: 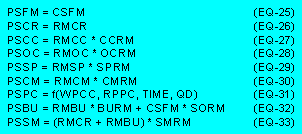
where PSFM, PSCR, PSCC, PSOC, PSSP, PSCM, PSBU, PSPC and PSSM, are the processors' supplies of fluid milk, fluid cream, cheddar cheese, other cheeses, soft products concentrated milk, butter, processed cheese, and skim milk powder, respectively; CCRM, OCRM, SPRM, CMRM, SMRM and BURM are technical coefficients relating the corresponding processors' milk demand to the related product, and SORM is a technical coefficient relating fluid milk production to butter from skimmed- off cream from fluid milk. The processors' supplies of fluid milk and cream are set to equal processors' demands.
Appendix 7. Consumer demand for dairy products.
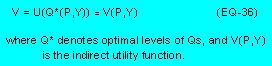
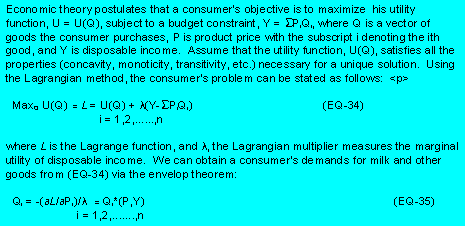 Note that (EQ-35) is similar to Roy's
identity derived from the indirect utility function. This is because the solution to the
Lagrangian problem in (EQ-34) is equivalent to solving the maximum utility function, the
indirect utility function. The indirect utility function, is of course, the result of substituting
the optimal levels of Qs back into the direct utility function, U(Q):
Note that (EQ-35) is similar to Roy's
identity derived from the indirect utility function. This is because the solution to the
Lagrangian problem in (EQ-34) is equivalent to solving the maximum utility function, the
indirect utility function. The indirect utility function, is of course, the result of substituting
the optimal levels of Qs back into the direct utility function, U(Q):
The importance of the envelop theorem is that it allows us to extract the demand function
directly from the Lagrangian in (EQ-34) without having to go through the whole
maximization procedure that is standard in the derivation of consumer's demands.
Hence, we can rewrite (EQ-34) as: 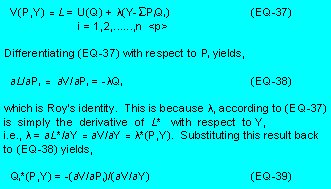
which is the most common form in which Roy's identity is defined in standard Microeconomic texts. Consumer's demands as defined in (EQ-35) and again in (EQ-39) are known as Marshallian demands. They are assumed to satisfy the homogeneity of degree zero in price and income as well as the adding up conditions.
The alternative to maximizing utility will be to minimize the cost of achieving a
predetermined level of utility, U. Using the Lagrangian method, this problem can be
formally stated as: 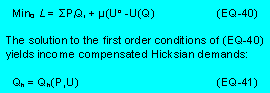
Note that EQ-41 can also be obtained directly from EQ-40 by means of the envelope theorem. This can be easily achieved by differentiating (EQ-40) with respect to Pi. The procedure is known as the Shephard's lemma. As (EQ-41) suggests, Hicksian demands are functions of product prices and utility. An important property of consumer demand as a result of the cost minimization approach is that, the cross effects of price changes are symmetric.
In general, we cannot sign the partial derivatives a priori, as this requires a lot more
knowledge about the goods than we normally do. As a result, the direction of the shift in
![]() the demand function given a change
in any of the parameters is an empirical matter. However, for a normal good, Qi, the
comparative statics are:
the demand function given a change
in any of the parameters is an empirical matter. However, for a normal good, Qi, the
comparative statics are:
Appendix 8. Expenditures and model identities.
Stage Two: The Translog Expenditure Share System. The basic translog
expenditure share system is modified following Manser (16) to account for habit
persistence in consumer behavior. The modification suggested by Tielu (22) is adopted
for advertising and demographic variables. 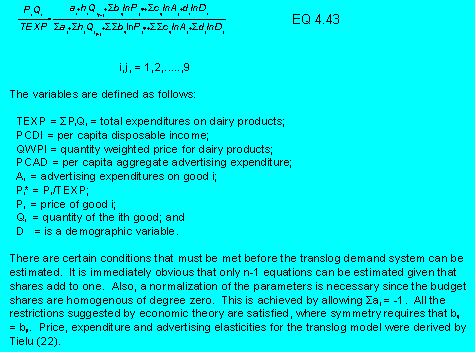
Identities
Several identities are needed to close the model, and they are given below:
Most of the variables in the identities have already been defined, but the rest are as
follows: SFQV and SIQV are static quota values for fluid and industrial quotas,
respectively; COMP is the cost of production; EXCO is exogenous cost; ADLV is
advertising levy; TFMQ is total fluid quota in the system; FSUB is the federal government
subsidy; NSBU, NSCM, NSSM, NSCC, NSOC, and NSPC, are net stocks of butter,
concentrated milk, skim milk powder, cheddar cheese, other cheeses, and processed
cheese, respectively; BUBS is beginning stocks of butter; BUES is ending stocks of
butter; NTBU, NTCM, NTSM, NTCC, NTOC, and NTPC are net trades in butter,
concentrated milk, skim milk powder, cheddar cheese, other cheeses, and processed
cheese, respectively; CDBU, CDCC, CDOC, CDPC, CDCM, CDSM, and CDSP are
consumer demands for butter, cheddar cheese, other cheeses, processed cheese,
concentrated milk, skim milk powder, and soft products, respectively; and CPCP and
OCPC are cheddar and other cheeses used in processed cheese, respectively.

The exogenous variables in the model include all government policy instruments, subsidies, advertising and other levies, and milk quotas. Other exogenous variables include disposable income, retail prices of butter and skim milk powder, other input prices, trades, and stocks other than butter. Trade in dairy products is highly restrictive and stocks are maintained at levels to absorb unexpected short in milk production.
![]()