The Only Constant is Change
Dairy farms in the U.S. can be characterized as capital, labor, and management-intensive businesses and it is likely they will continue to be one of most intensive sectors of agriculture as we move through the final decade of the 20th century and into the 21st century. Reduced government involvement at the price support and marketing order level is likely within the next several years. The commercial availability of bST for improving production efficiency; improvements in our understanding of dairy nutrition, down to the amino acid level; a futures and options market trading cheese; non-fat dry milk and fluid milk contracts for managing price risk; the introduction of a host of new dairy products being presented to the consuming public, movement toward freer trade throughout North America and the world, are just a few of the recent developments that are having a dramatic impact on the US and international dairy sectors. This structural change, as is the case with any change, will undoubtedly result in winners and losers.While some would argue that the changes in the dairy business over the previous ten years are nothing compared to the changes that will occur in the next ten years (revolutionary versus evolutionary), it depends upon one's perspective. We can only reflect how constant the change in the dairy industry has been over the past ten years and anticipate the challenges and opportunities facing this industry over the next ten years and beyond, with assurance that the only constant will be change.
The average size of dairy farms in the US will continue to increase with numbers of dairy businesses decreasing. While animal, crop, and people productivity will increase, government involvement in the dairy business will continue to be reduced, labor supplies will tighten, and environmental, ethical (e.g. animal welfare, genetic manipulation), and food safety issues (e.g. residues) will receive increased attention by consumers and policy makers. So how can dairy managers and those providing goods and services to the dairy sector prepare for the 21st century?
Capital Efficiency
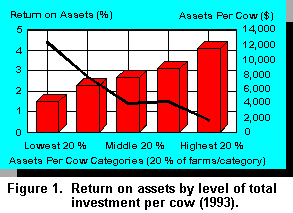 A key challenge facing the upper midwest and northeast dairy industry regions in the US
(traditional dairy regions) is the relatively high capital investment in the dairy operation and
correspondingly low return on assets. Figure 1 depicts a group of Wisconsin dairy farm businesses
(n=910), stratified by their average level of capital investment (farm market valuation of assets).
Each of the five bars in the bar chart corresponds to 20% of the farm businesses in the sample. The
average investment per cow is represented by the height of the bar in relation to the assets per cow
designation on the right axis. The black line corresponds to the average return on assets
corresponding to each 20% of the farms. The return on assets decreases from a high of nearly 5%
to less than 1% for those farms with average assets per cow in excess of $10,000! One must
remember that these investment levels will typically include the crop and heifer enterprises
(equipment, facilities, animals, and land). Average productivity per cow has slipped in most of the
upper midwest and northeast dairy states compared to other major dairy states. This decline
lowers their average relative production efficiency and often challenges the ability of the
processing sector to maintain milk plant efficiencies at a high level.
A key challenge facing the upper midwest and northeast dairy industry regions in the US
(traditional dairy regions) is the relatively high capital investment in the dairy operation and
correspondingly low return on assets. Figure 1 depicts a group of Wisconsin dairy farm businesses
(n=910), stratified by their average level of capital investment (farm market valuation of assets).
Each of the five bars in the bar chart corresponds to 20% of the farm businesses in the sample. The
average investment per cow is represented by the height of the bar in relation to the assets per cow
designation on the right axis. The black line corresponds to the average return on assets
corresponding to each 20% of the farms. The return on assets decreases from a high of nearly 5%
to less than 1% for those farms with average assets per cow in excess of $10,000! One must
remember that these investment levels will typically include the crop and heifer enterprises
(equipment, facilities, animals, and land). Average productivity per cow has slipped in most of the
upper midwest and northeast dairy states compared to other major dairy states. This decline
lowers their average relative production efficiency and often challenges the ability of the
processing sector to maintain milk plant efficiencies at a high level.Production and Economic Efficiency
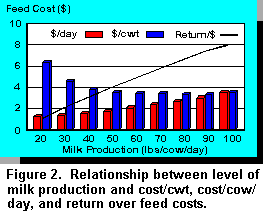 Profitable dairy farms can be characterized as having high production efficiencies, reasonable
income levels, and a relatively low cost of production. The average milk production per cow for
many farms continues to be at a level insufficient to support the total cost of milk production in the
longer term. However, the number of dairy farms producing more than 9,000 kg of milk per cow is
increasing. This will likely be the average level of production on dairy farms in the year 2000 for
herds enrolled in the Dairy Herd Improvement (DHI) program. The productivity gap between
those participating in a DHI management program and those not participating has widened to
nearly 3,000 kg more milk per cow. Figure 2 depicts the consistent relationship that exists
between milk production efficiency and economic efficiency of converting feedstuffs to milk
through the dairy cow. Using typical cost:price relationships in the midwest we can see that higher
levels of production efficiency almost always pay where diligent cost control is practiced.
Profitable dairy farms can be characterized as having high production efficiencies, reasonable
income levels, and a relatively low cost of production. The average milk production per cow for
many farms continues to be at a level insufficient to support the total cost of milk production in the
longer term. However, the number of dairy farms producing more than 9,000 kg of milk per cow is
increasing. This will likely be the average level of production on dairy farms in the year 2000 for
herds enrolled in the Dairy Herd Improvement (DHI) program. The productivity gap between
those participating in a DHI management program and those not participating has widened to
nearly 3,000 kg more milk per cow. Figure 2 depicts the consistent relationship that exists
between milk production efficiency and economic efficiency of converting feedstuffs to milk
through the dairy cow. Using typical cost:price relationships in the midwest we can see that higher
levels of production efficiency almost always pay where diligent cost control is practiced.Benchmarking Performance
Business managers should make a concerted effort to understand the strengths and weaknesses of their businesses. This is often accomplished by slicing the business into component pieces (cost, profit centers) and comparing the performance of the pieces to industry standards or benchmarks. Since averages only go so far, the benchmarks are most often developed for similar sized businesses. With the recognized economies of size that exist in the dairy industry, Table 1 (Click here to view Table 1). depicts some key performance benchmarks for upper midwest US dairy farms stratified by herd size (<50 cows, 50 to 99 cows, 100 to 199 cows and > 200 cows).
There are some notable similarities and differences when herds are stratified by size. However, it is important to recognize that dairy farms in the first two size categories are typically characterized as having older labor and capital inefficient production facilities (tie-stall, stanchion) versus the larger units where free-stall / milking parlor production facilities would be the predominant production system. In general, as herd size increases: productivity and profitability increases. However, it would appear that the differences across the three larger size categories are more similar to each other, due in great part to the high variation in performance that exists within each sub-group.Note that the second line (bold and italics) for each performance measure represents the average for the top 50% of farms in that size category based upon net income to operations.
A recent summary of 1993 dairy farm financial records from 874 Minnesota dairy farms shows large farm-to-farm differences in price, cost, and volume. Table 2 (Click here to view Table 2). compares some key production and economic performance measures of performance for: the high 20%, average, and low 20% profit dairies. The comparison of high and low profit dairies reveals some important differences. These differences are highly consistent with other dairy profitability studies (6) and can be summarized as follows on how the high profit group differed (some additional important characteristics of high profit dairies revealed in other studies are included).
High Profit versus Low Profit Dairies
![]() Price/Income Performance
Price/Income Performance
![]() Cost Control
Cost Control
![]() Capital Use
Capital Use
![]() Production Performance
Production Performance
*Identified in other studies as important profit characteristics.
Balanced Management
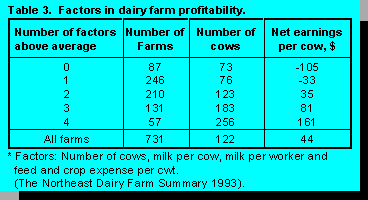 The factors affecting profitability are
interdependent. Profit results are dependent on managing
several factors to above average levels. Table 3 was prepared by the Farm Credit Banks of
Springfield (MA) of 731 dairy farms in the northeastern U.S. The more factors the business
performed better than average in, the higher the average net earnings per cow.
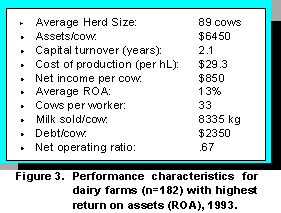
 When we look at the top 20% of the farms in terms of return on assets (ROA) we see a more favorable cost and returns picture (Figure 3). These nearly 200 Wisconsin dairy farms had an average net income per cow approaching 2.5 times that of the average of the sample of farms. These farms are larger than the average and have lower investment levels per cow and practice better cost control.
Cost Control is Key
Net operating ratio (operating expense ratio) is a measure of the businesses ability to generate returns while controlling costs. It is computed by dividing the total operating expenses (excluding interest, depreciation, and family living expenses) by the total returns. The highest profitability farms have an operating expense ratio of less than .65. This means that every dollar of sales is generated with less than 65 cents in operating cost. In contrast, the lowest profitability group of farms represent those that are spending nearly 90 cents in operating expenses for every dollar of operating income. Net operating ratios of less than .65 are characteristic of businesses practicing good cost control while generating high returns.
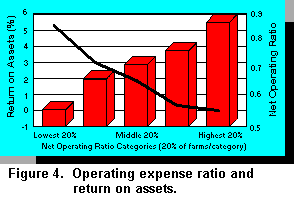 Figure 4 shows the relationship between the
average net operating ratio and the profitability (measured by return on assets (ROA)) for this
same sample of farms in 1993. As average herd sizes continue to increase many farm families will
be faced with some challenging decisions relative to upgrading or replacing facilities and
equipment while using capital and labor efficiently. Dairy farm managers must closely monitor
and control both fixed and variable costs of production in order to remain competitive.
Maintaining herd sizes large enough to obtain the major economies of size and using capital
resources efficiently is important across all herd sizes. We can expect to continue to see an
increase in the number of multi-family dairy farm operations. These operations will provide an
opportunity to improve capital, labor efficiency, profitability, and quality of life, given an
appropriate management structure. Facility and equipment replacement decisions will also be very
important to the longer term success of these as well as single family operations.
 Labor Efficiency
With the cost of labor continually increasing and the proportion of the cost of production represented by labor expense, labor efficiency becomes an increasingly important performance measure to evaluate and monitor. Obviously, the labor efficiency of an operation is directly related to how labor-intensive the production system and the level of output generated from the labor input. The labor efficiency is also related to the level of mechanization which may translate into higher capital investments. Therefore, it becomes a process of balancing the inputs to the production process in such a way as to meet your business and personal goals. A common measure of labor efficiency which is relatively easy to compute is pounds of milk (or cwt milk) sold per worker. This computation is significantly influenced by your definition of a "worker equivalent". We might typically define a full-time worker as an adult that works 50 hours/week for 50 weeks per year which translates into 2500 hours. You might adjust this up or down depending upon your particular situation. However, it is important to include both family, hired, and operator labor in the calculation. Obviously, the level of diversification on the farm, particularly the amount of feed raised versus purchased and whether or not heifers are raised on the farm, can greatly impact the computation and value of making comparisons across dairy farm businesses. However, if we assume a typical upper midwest dairy operation that raises their own heifers, produces the majority of the forage and some of the grain required by the herd, and replacements we can make some useful comparisons and characterize relationships between performance measures.
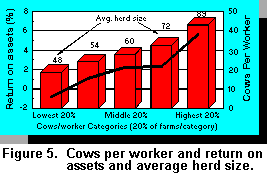 Figure 5
shows the relationship between cows per worker and profitability. The lowest cows per worker
category (far left bar) were characterized by the lowest average return on assets and smallest
average herd size. The average herd size tended to increase as the cows per worker increased
across the five (20%) categories, as did the average profitability (measured by return on assets).
Obviously, one of the challenges in making such comparisons across a diverse group of farms is
the relative level of specialization. Farm businesses with significant cropping enterprises will
typically have lower labor efficiencies than those with crop enterprises that more closely match the
production of forages to meet the needs of the dairy herd and replacements. To make these
comparisons more reasonable across businesses, we would need to have an enterprise accounting
system that would separate the major enterprises into their respective cost and profit centers.
Numerous labor saving technologies have been developed and implemented in many dairy farm
businesses. Balancing labor and capital is an important function of management. Dairy farms with
higher levels of labor and capital efficiency tend to have higher levels of labor and management
income per operator. The efficiencies (capital and labor) of many labor saving technologies (e.g.
milking parlors) are only captured with increasing herd size. There is a tendency on many
managers parts to oversize a milking parlor to reduce the number of hours spent milking. This
approach will likely result in dis-economies when compared to using existing facilities or a
transitional facility (e.g. flat-barn milking system). The high capital investment per cow is
obviously one of the most significant contributing factors to slower capital turnovers and
correspondingly lower rates of return on assets.
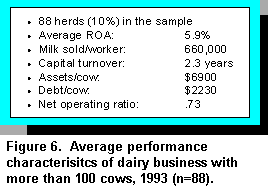 Figure 6 shows the average performance
characteristics for a sample of dairy farms with more than 100 cows. While the average capital
investment per cow is lower and the return on assets higher than the overall average, the
opportunity to reduce the level of capital investment per cow will probably improve the overall
profitability of these businesses over time. Monitoring and controlling the performance of the dairy
business is a demanding management task. However, it is crucial to routinely be measuring the
performance of the business in order to determine what aspects are working well and be able to
identify those factors that could be improved upon by taking a closer look at the factors within the
control of the manager. Successful dairy farms will be those that can adapt to changing economic
conditions, evaluate and adopt cost-effective new technology, and achieve business and personal
goals of the people involved in the business.
Specialization versus Diversification
Many upper midwest dairy farms are at a crossroads in trying to find better ways to reach their goals. Profitability and family life styles are two primary driving forces. The typical upper midwest dairy farm is highly diversified in demands for capital, labor, and management know-how. All of these resources are stretched so thinly that it is often difficult to compete. Farm families are looking for ways to work smarter, not harder and longer.
Options under consideration often include: grazing, expansion, use of consultants, networking with other farmers, specialization, contracting, exiting the dairy business, surviving to retirement, etc., etc. A 1994 University of Minnesota study explored three alternative dairy production systems:
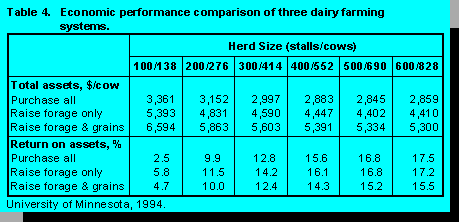 The analysis was based on a new startup dairy with the land and field cropping machinery
investment determined by the cropping plan. The systems were analyzed over a range of herd sizes
from 138 to 828 cows. The dairy facilities, parlor, manure system, feed storage, and housing, were
designed to meet herd sizes. Summary results are shown in Table 4.
These estimates would be most representative of a new start up dairy and may not be applicable to an individual farm or an existing dairy operation that is planning to expand. However, the results suggest some key points:
Summary
To maintain a competitive edge in any business today requires that the manager have well-honed production and management skills. Most dairy farmers enjoy working with cows, crops, and the associated facilities and equipment and have a reasonably good understanding of recommended dairy and crop production practices. Some dairy farmers enjoy the herd management activities more than the crop management activities or enjoy working with the cows more than replacement heifers. Since the vast majority of dairy farmers in the upper midwest and northeastern US raise most, if not all, of their forage crops and some grain crops, the herd and crop management activities are necessarily interrelated and it is therefore of paramount importance that the dairy manager recognize the importance of managing the dairy farm as an integrated dairy production system. The success of most dairy farms will continue to rest on the managers ability to produce and/or purchase high quality forages and market them profitably through the dairy herd. Matching dairy herd and replacement needs to the cropping enterprise(s) is often not a conscious planning step, although it needs to be in order to monitor and evaluate opportunities to manage and control the single largest cost category. Evaluating the costs and returns associated with the cash grain enterprise(s) is a crucial step to projecting the longer-term profitability of the dairy farm business, particularly with respect to capital replacement costs. Monitoring the grain and byproduct markets will provide many dairy farm managers with the opportunity to control costs while maintaining high production efficiencies. Managers that are "informed opportunists" use their creativity to continually evaluate the cost and profit centers throughout the business on an ongoing basis.
The following which appeared in Hoard's Dairyman, "105 years ago....(W.D. Hoard)" is probably as valid today as it was over 100 years ago :
"Among the patrons of every cheese factory and creamery in the land, you will find a few who are making double the profit on their cows that others are. What causes the difference? Simply the exercise of better thought, better knowledge and more energy. Too many refuse to believe that this business requires intelligence. They are being severely punished year after year for their skepticism".
The progressive dairy farm manager of today and the future recognizes the importance of adopting and implementing profitability-enhancing production and management practices and techniques. He/she views the dairy farm as a business and himself/herself as a business manager striving to achieve business and family goals through the operation of a profitable dairy. Business management skills are learned behaviors (although you often hear people say, "he/she was born a manager") and are difficult to teach. This coupled with rapid advances in technology and an uncertain economic, political, and social climate, make for exciting challenges and numerous opportunities for all who play a role in the dairy industry today... and what will be the dairy industry of tomorrow !!
References
1. Conlin, Bernard J. 1994. Structural Changes in the Livestock Industry: Strategies for Minnesota Dairy Producers. Livestock Systems, University of Minnesota Extension Service.
2. Conlin, Bernard J. 1993. Characteristics of High Profit Minnesota Dairies. Dairy Update Issue 115. Animal Science Extension, University of Minnesota.
3. Conlin, Bernard J. 1991. Managing $10 Milk: Prospectives on Dairy Inputs and Outputs. Dairy Update Issue 106. Animal Science Extension, University of Minnesota.
4. Filley, A. C. 1978. The Complete Manager. The Greenbriar Press, Middleton, WI.
5. Frank, G. and J. Vanderlin. 1995. Estimated milk production costs in 1993 on 488 Wisconsin dairy farms. In: Managing the Farm. Dept. of Agricultural Econ., UW-Madison.
6. Smith, T.R. and B. J. Conlin. 1995. Evaluating Options, Managing Risks and Improving the Performance of Your Dairy Production System. Four State Dairy Farm Expansion Conference. Rochester, MN and Stevens Point, WI., November 7-9, 1995.
7. Smith, T.R., L.P. Johnson and S. Kenyon. 1995. Dairy Business Focus: Benchmarks for the Future, Tips to help Wisconsin dairy farms continue to compete. Special insert in: The Wisconsin Agriculturist Magazine, Farm Progress Publications. 8pp.
8. Snow, Cleave T. 1994. The Northeast Dairy Farm Summary 1993. Farm Credit Banks of Springfield, Springfield, MA.
9. Splett, N. 1995. Dairy Farm Business Summary - 1994. UW-Center for Dairy Profitability Agricultural Resources Center Series 95-2, UW-River Falls.
10. Tomes, K. J. 1995. AgBase Financial Database - Similar Farm Analysis - 1994. AgriBank, FCB. St. Paul, MN.