Introduction
As dairy herds in Western Canada grow, it is likely that the average herd size in the future could be double what it is today. If this is to be the case, then Western Canadian dairy producers need to know what factors contribute to the financial success of larger herds. Moreover, they will need to know how decisions regarding these factors differ from those taken on smaller herds. In this analysis Alberta data is used to evaluate the effect of various factors on production efficiency. However, the results can also be applied to other prairie provinces.Evidence from other regions show that the ability to successfully manage large herds is critical to achieving the lowest possible costs. Both Jeffrey (6) and Barichello and Stennes (2) attribute the relatively low costs of production in California to economies of size - herds in this region are able to achieve low costs despite the natural disadvantage of being a feed deficit region. Clearly, these economies of size must be reflected in other management decisions that outweigh the higher costs of feed. In a dairy environment more like Alberta's, Grisley and Gitu (4) find limited evidence of scale economies for dairy production in Pennsylvania. In the Northeastern U.S., Bruun and Adelaja (3) find stronger support for lower costs among larger dairy herds, but argue that this advantage is offset by the reduction in "flexibility" of production.
In a sample of Washington dairies, Matulich (7) finds that large herds (1200 cows) have a 6.25% cost advantage over smaller herds (375 cows) due primarily to lower building, equipment, labor, insurance, and taxes. Of these factors, the largest potential savings come from more efficient utilization of labor. Technological change plays a large role in the presence of economies of size. Using data from 1967-81, Hoque and Adelaja (5) find that there were no economies of size in the earlier part of their sample, but by 1991 herd size had become an important factor in reducing costs. Similarly, Moschini (8) shows that there are significant long-run economies of scale in Ontario dairy. The interaction between technology and herd size is not limited to North America as Mukhtar and Dawson (9) show that the average cost of producing milk in England and Wales has fallen over time as average herd size and the sophistication of dairy technology grow. This study looks at the contribution of several key managerial decisions on the ability to take advantage of size economies - decisions concerning the amount of feed, amount of labor, level of milk production, or the amount of investment in buildings and machinery. Because many of these factors have constraints in the real world - the availability of farm labor is commonly cited as a prime example - this analysis uses farm-level cost data from farms that face the same constraints as current Western Canadiain dairy farms.
The paper is organized as follows. The first section reviews the economic theory of production with an emphasis on how economies of size work. The second section applies this theory to a simple model of dairy production to show how better use of one input, labor, can lead to significant savings through taking advantage of economies of size. The third section describes the data and statistical procedure that tests for producers' ability to use other factors in a similar way. The fourth section presents and interprets the results of the analysis for three alternative measures of performance: operating cost, total production cost, and return on equity. The final section outlines the conclusions to be drawn from these results for dairy production in Alberta and suggests some implications for the future.
Economic Theory of Production: Economies of Size
This section reviews some of the fundamental economic theory of how costs of production change with the size of the farm. The objective in discussing this theory is to show why the cost of producing milk is expected to differ for herds of different sizes. First, this theory relies upon the distinction between short-run and long-run decisions.Short-run input decisions concern how much of each variable input to use - the amount of grain, hay, or hired labor, for example. This categorization of variable input is debatable. Hired laborers on a fixed annual salary are often defined as fixed costs rather than variable costs. Likewise, fertilizer used in crop production contributes directly to production, but once in the ground cannot be recovered and sold, so is also often considered a fixed cost. Therefore, considerable care must be taken in defining the truly variable costs of each operation.
A long-run decision, on the other hand, is one that involves inputs that can only be changed over a longer period of time - the milking herd, barns and milking equipment, or adding more family labor, for example. In contrast to variable inputs, these inputs are "fixed" or slow-to-adjust. The distinction between these types of inputs is important in differentiating variable and fixed costs.
Purchasing variable inputs incurs a variable cost. In other words, a variable cost is one that changes directly with the level of output. For example, using more feed tends to increase milk yield over some range of production, but costs rise proportionately. Fixed costs, on the other hand, do not change with the level of output. Heat, electricity, rent, and interest are all examples of fixed cost.
 Average variable costs, or the cost of grain or hay per hectolitre, depend not only on the price of
the input and the amount used, but also the level of production that results. The following example
shows how a hypothetical set of variable costs vary with feed usage. At low levels of feed use, it is
likely that the cows are underfed, so are not producing up to their potential and are not producing
at minimum cost. At the other extreme, trying to feed too much leads to waste and unnecessarily
high costs as cattle have natural limits on their abilities to intake feed and to convert it to milk.
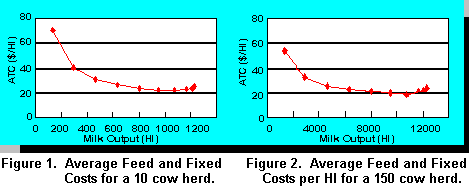
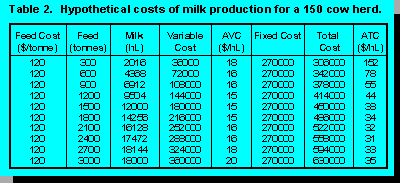
This is the "Law of Diminishing Marginal Returns" to milk production. Table 1 provides some
hypothetical numbers that reflect this logic. The 100 tonnes of feed and 800 hL of milk point is the
average for all participants in the 1994 Dairy Cost of Production Survey.
Figure 1 shows this same information in a graphical form. This figure shows the "U-shaped" average variable cost (AVC) - AVC falls at low levels of production, reaches a minimum and then begins to rise as too much feed is used.
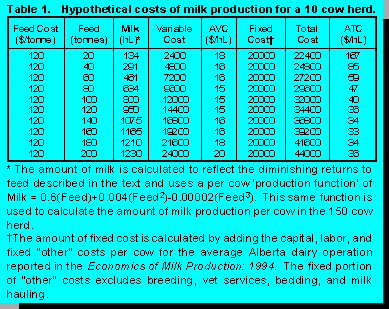
Comparing Table 1 to Table 2 shows how average costs differ between small herds and large herds. Notice that no assumption is made about the relative productivity of the two herds. If the small herd achieves the same milk yields as the large herd for the same levels of feed, then the variable costs are the same. However, the total cost differences appear in the fixed cost component. Assuming that the amount of investment per cow is the same for a small and a large herd ($7000), then all of the costs associated with buildings and machinery (power, depreciation, natural gas, etc.), will be the same. However, large herds in Alberta use 25% less labor per cow than small herds (1), and labor comprises 40% of all fixed costs. Therefore, the fixed costs per cow should be about 10% lower for a large compared to a small herd. This assumption lies behind the comparative cost values in Table 2 and the average cost curve shown in Figure 2. Clearly, the ability to make better use of labor causes the average cost of milk production to be lower on the large versus small herds.
This example shows how it is possible for a large herd to exhibit economies of size. A reduction in
costs due to increasing herd sizes is often referred to exploiting "economies of scale". However,
changing the scale of the operation means that all inputs are changed in the same proportion,
whereas this example shows only a change in the size of the cattle herd. Even though the feed
costs and the productivity are the same for both herds, the larger operation is able to operate more
efficiently. Because the number of cows is fixed in both cases, each figure shows a short-run
average cost curve. In the long-run, however, all inputs are variable, so the farmer can only choose
the lowest possible cost combination of all inputs. Therefore, the long-run average cost curve must
lie below all possible short-run curves. Logically, if a producer is free to choose the best amounts
of every input in the long-run, then he can do no better in the short-run when constrained to a fixed
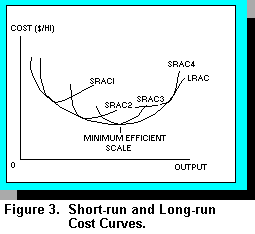 level of some inputs. Graphically, the long-run average cost curve is simply the curve that touches
all of the possible short-run curves. Figure 3 shows this "envelope" relationship between the
long-run average cost curve and the short-run curves. Choosing the herd size that corresponds to
the lowest point on the long-run average cost curve is called choosing the "minimum efficient
scale" (MES) of herd size. Although this analysis focuses on the role of labor in achieving
the MES level of production, there are many other factors that can lead to the same results.
However, there is one common element among these factors - the existence of excess capacity. If an input is not being fully utilized, then it will be possible to get more output without buying or hiring more of the input. Essentially, by fully utilizing all of the inputs or assets already owned by the farm, it is possible to spread more litres of milk over the same amount of inputs, so productivity rises and costs fall. This is one source of the rapid productivity gains throughout the economies of North America in the early 1990's - capacity utilization rates among manufacturers in the U.S., for example, have exceeded 85% for an unprecedented length of time. By analogy, therefore, a renewed attention to capacity utilization will allow dairy producers to increase their rates of productivity growth even faster than they are now.
"Productivity" in dairy is often defined as simply the amount of milk output per cow. However, this is only a partial measure of productivity as milk production requires more inputs than just cattle. True productivity measures the amount of milk obtained considering the whole basket of inputs - labor, buildings, equipment, feed, vet services, etc., including cattle. Alternatively, productivity growth can also be defined in terms of costs. If the cost of production falls over time, with input prices constant, then productivity must be growing. One way to increase the level of capacity utilization, for example, is to milk three times per day. Although there are good reasons why producers do not milk 3X, on a purely economic basis, this practice does make better use of the existing herd size, the milking facilities, and salaried labor. Many of the large herds in the U.S. Southwest operate 24 hours per day with three shifts of milkers continually milking or cleaning the parlor. Capacity utilization, however, is only part of the economies of size story.
There are several other ways that large herds are able to reduce their costs of production. Many feel that larger herds may have lower costs due to their access to better technology. Only the largest herds can justify having their own feed mill, a professional herd manager, or a veterinarian on staff to administer bST or embryo transplant programs. Second, large herds may be able to get bulk discounts on feed and other input purchases. For example, being large enough to buy feed in bulk lots rather than by the bag, is a clear source of savings. Third, there are economies of size within each short-run average cost curve. As the amount of milk production increases, fixed costs are spread over more litres of milk. Therefore, the fixed cost per litre declines as production increases. Although this section clearly demonstrates that economies of size are possible, it remains to show whether Western Canadian milk producers exploit these economies, and if they do, how do they do it. The next section considers some of the key management factors that contribute to low-cost operation of large herds.
Critical Management Factors in Dairy
In order to compare the input decisions, productivity, and financial performance of farms that differ in size, it is necessary to express each input and output level either in terms of a percentage, on a per cow basis, or per hectolitre (hL). In this way, comparisons of input decisions are made independently from the choice of herd size.Appleby (1) defines these input decisions as "management factors". Cross-tabulating these management factors, as in the Economics of Milk Production in Alberta, provides a valuable analysis of the keys to success for Alberta dairy farmers. These factors include: the number of years the producer has been in dairy, the size of the milking herd, production per cow (hL/cow), investment in buildings and machinery per cow ($/cow), feed per cow (kg/cow), the amount of debt per cow ($/cow), and the total of hired and family labor per cow (hrs./cow). This study also considers others, such as the proportion of all forage, or the proportion of grain and concentrates, that is purchased. These critical management decisions do not, and cannot, constitute an exhaustive treatment of the number and complexity of the decisions that dairy producers must make, but they do capture or proxy those that are most important.
The measures of performance consist of operating cost ($/hL), total cost ($/hL), and the return to equity (%). Operating cost consists of feed costs, labor costs, and "other" costs as defined in the Economics of Milk Production in Alberta. Total costs include all the components of operating cost in addition to the capital costs of rent, depreciation, and interest payments. Net income is the sum of all milk sales, cattle sales, net subsidies, and inventory adjustments less total production cost. The ratio of net income to the net worth, or equity, in the farm gives the return to equity. The following section describes the data used to compare the factors contributing to the financial performance of herds of various sizes as well as the methods of comparison.
Data and Methods
This study uses farm-level data from the Alberta Milk Producers' Society Cost of Production Survey over the years 1989-91. During this three year period, there are an average of about 60 participating producers/year, for a total sample size of 181. As participation in the survey by milk producers is entirely voluntary, many of the producers do not remain in the survey for the entire three-year period. Details on the survey method and the principles used to define the various cost categories can be found in Appleby (1). Alberta Agriculture economists use these data to evaluate and monitor the performance of the milk pricing formula.For the purposes of this study, each of the management factors is assumed to influence either the level of cost, or the return to equity of the farm. However, it is often difficult to isolate the independent influence of each factor by comparing each factor to each performance measure one at a time. For example, if it is found that the most experienced 10% of producers have lower costs than the least experienced 10%, this may be due to the more experienced farmers using different levels of investment per cow than the younger farmers, and not due directly to their greater experience. Therefore, this study uses statistical methods that determine the independent influence of each factor when all factors are considered together. This method shows the effect of each factor on cost or return holding all other factors constant. In other words, the results show how the producer who is average in all respects can change his or her performance by changing one factor at a time.
This statistical procedure is applied to producers of all sizes together, and then to several herd size groups independently. The first group consists of producers with less than 50 cows (small), the second group is from 51 to 75 cows (lower-medium), the third from 76 to 100 cows (upper-medium), and the fourth considers all herds greater than 100 cows (large). Although the goal of this study is to define those factors relevant for a 150 cow herd, there are too few herds of this size in the sample to make any meaningful conclusions, so the lower limit is reduced to 100 head. According to the cost-curve theory discussed above, the relationship between cost and the size of the operation should not be a direct one, or linear, but is a curve. Therefore, the "herd size" factor enters the model both as a linear and a squared value, or as a quadratic function.
Results
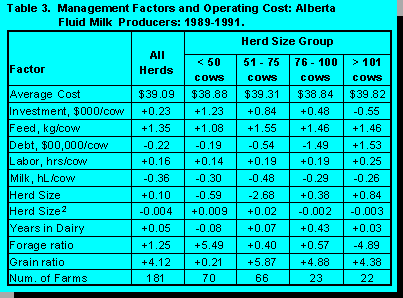 The results of this statistical procedure are shown in the tables below. In each of these tables, the
value in each box shows the change in the measure of cost or return for a one unit change in the
factor in the left-side column. For example, Table 3 shows the relationship between operating cost
and each of the management factors for all herds together, for small herds, for lower-medium sized
herds, for upper-medium sized herds, and for large herds. For all herds, the average operating cost
is $39.09 per hL, but a producer that invests $1000 more per cow than the average may expect his
cost to rise by $0.23 per hL. Similarly, a producer that feeds one more kg per cow than the average
producer expects his operating cost to be $1.35 greater than average. Interpreting each of the
management factors in this way allows a comparison of the factors that influence operating cost
between each of the herd sizes.
 Whereas the amount of investment per cow causes operating cost to be higher than average for the smaller herds, a higher level of investment for the largest herds (> 100 cows) causes operating cost to fall by $0.55 for every $1000 per cow. This reflects the notion above that some cost-saving technologies may only be viable for the largest farms. Although the amount of feed per cow does not seem to affect the difference in operating cost between herd sizes, the level of debt per cow does. Because the definition of operating cost does not include interest expense, the positive effect of debt on operating cost reflects the constraints that high debt levels present for efficient operation. Cash flow constraints often cause producers to make different production decisions than they otherwise would. Interpreted another way, this result means that large farms are able to realize greater cost savings through debt reduction than smaller farms.
Operating costs on larger herds are also more sensitive to hiring excess labor. An additional hour of labor per cow causes operating cost to rise by $0.25 per hL for large herds, but only by $0.14 per hL for the smallest group. However, higher milk yields cause operating costs to fall significantly less with large herds than small. Whereas costs fall by $0.26 per hL for large herds, they fall by $0.30 for small herds. This table also shows that more experienced dairy farmers can expect to have operating costs that are $0.03 per hL higher than average for every year of experience. The quadratic herd size variable is less straightforward to interpret. However, because it is a curve, it defines a point of minimum efficient scale in operating cost. Calculations using the estimates in Table 3 indicate that the lowest cost herd size consists of 140 head.
Perhaps the greatest effect on the cost differential between large and small herds is explained by the ratio of purchased to homegrown forage. Whereas the additional cost of purchasing concentrates is consistent across all herd sizes, the largest herds reduce costs by $0.49 for every 10% increase in the proportion of forage bought in, while the smallest herds can expect costs to rise by $0.55. This may reflect such things as savings in bulk transportation, continuing supply relationships, or more leverage in price negotiations. A similar analysis shows the factors that are important in differentiating total production costs between small and large herds.
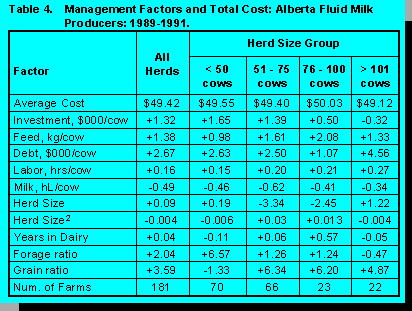 Table 4 shows the relationship between total cost and the management factors for each herd size
group. On average, production costs for the largest herds are only slightly lower than for the other
groups. As in Table 3, it is clear that additional investment per cow leads to a cost advantage for
larger herds, whereas higher levels of debt reverse this advantage. The effects of labor and milk
production are also similar to those shown above - larger herds are more sensitive to changes in
employment, but are less sensitive to changes in milk production. This latter result is not
surprising as average fixed costs are much less important to larger herds than small. Among the
large herds, the minimum cost herd size appears to be 153 head. As with operating costs,
purchasing forage represents a major source of the cost advantage for large producers over small.
Although the total production cost and operating cost results are similar, the factors that determine
profitability may be quite different.
Table 5 shows the relationship between the return on equity and the management factors. In this case, two additional management factors, the average butterfat test (%), and the ratio of fluid to industrial milk deliveries, help to explain the financial performance of the operation. Whereas the average return to equity of 47.19% is considerably higher than the average of the smallest herds, the 76 - 100 cow group outperforms all others. Increasing butterfat content by 1% reduces the return to equity by 0.09, or by 9% - a far larger effect than for the next smallest herd size and opposite in direction to the lower-medium and small herds. The return to equity of large farms is also very sensitive to the proportion of fluid deliveries. Increasing this ratio by 1.0 (ie. from 0 to 1) reduces the return to equity by 34.5%. Whereas higher investment per cow is associated with low costs of production, Table 5 shows that higher investment also explains a 7.24% lower return to equity for each $1000/cow among the largest farms.
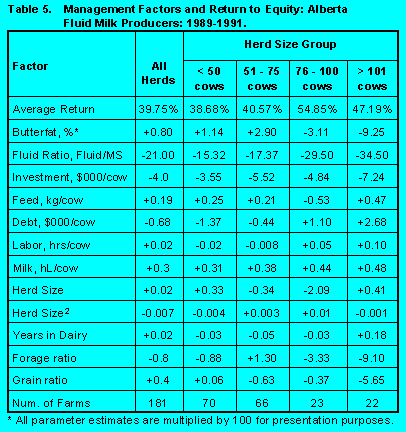
Higher debt levels cause the return to equity to rise through the effects of financial leverage. Financial leverage works to magnify the returns to equity in two ways. First, the greater the level of debt for a given level of assets, the lower is a producer's equity stake. As a result, the same level of income will produce a higher percentage return on a smaller amount of equity. Second, interest on debt is tax deductible, so the value of the tax shield causes net income to be higher than for a low-debt operation.
Perhaps surprisingly, given the cost results above, higher levels of labor per cow lead to higher returns to equity compared to the smaller herd groups. This implies that the large producers use their additional labor to generate other sources of revenue for the operation. Similarly, higher milk yields also cause the return to equity to rise. The herd size estimates indicate that the best herd size in terms of return on equity is 205 head - considerably larger than the level that minimizes either measure of cost.
Producers with more experience are better able to make large herds profitable than small ones. Comparing this result to the cost results above suggests that the value of experience comes not through cost management, but by taking a "whole enterprise" perspective in order to maximize profits.
Although purchasing forage reduces costs for the largest farms, it causes their overall profitability to fall. Because this effect is independent of the milk yield and fat content, the lower profit must be due to various problems caused by the loss of control over the quality of purchased forage and concentrates.
Conclusions
This paper shows that there are many ways in which Alberta dairy farmers can take advantage of the economies of size in larger herds to reduce their costs of production. In the short-run, when some inputs to milk production are essentially fixed, the best way to reduce costs is to ensure that all of the fixed inputs are used to their maximum capacity. By spreading a fixed cost over a larger amount of output, it is possible to lower the average cost per litre. In Alberta, labor appears to be underutilized by small herds. Therefore, the ability of large herds to make more effective use of salaried workers represents a possible key to their success.Empirical evidence from the Alberta Milk Producers' Society Cost of Production Survey supports this conclusion. In terms of total costs of production, reducing labor requirements by one hour/cow will save $0.27/hL for a large herd, but only $0.15/hL for a small herd. Other contributors to a possible cost advantage for large herds include a higher level of investment per cow, and purchasing forage rather than growing it on the farm. While the use of debt increases the profitability of the farm through financial leverage, the advantage to buying in feed disappears when performance is measured by the return on equity. In order to achieve a high return to equity, the larger herds in the sample feed more on a per cow basis, obtain slightly higher milk yields, are more experienced managers, and buy less feed from off-farm sources.
While the results of this study accord well with expectations, it should be noted that the size of the sample is smaller than what would be ideal. Future research in this area would benefit by including more producers over a wider range of herd sizes and covering a number of different years. Variations in feed quality from year to year may influence the results when considering only three years of data.
Additional Readings
WCDS-1995:The Canadian Dairy Industry in 2010 - A Producer's Perspective
Applied Dairy Science Course - University of Alberta:
Stucture and Issues
of the Dairy Industry
References
1. Appleby, T. 1995. "The Economics of Milk Production in Alberta" Production Economics Branch, Economic Services Division, Alberta Agriculture, Food & Rural Development. Edmonton, AB.2. Barichello, R. and B. Stennes. 1994. "Cost Competitiveness of the Canadian Dairy Industry: A Farm Level Analysis". Paper presented at the "Supply Management in Transition Conference", MacDonald College, McGill University, Ste. Anne de Bellevue, Quebec. June 28-30.
3. Bruun, M.C. and A.O. Adelaja. 1990. "Economies of Scale and Output Flexibility in Northeastern U.S. Dairy" Paper presented at the AAEA Meetings, Vancouver, B.C., Canada.
4. Grisley, W. and K.W. Gitu. 1984. "The Production Structure of Pennsylvania Dairy Farms" Northeastern Journal of Agricultural and Resource Economics 13(2):245-53.
5. Hoque, A. and A. Adelaja. 1984. "Factor Demand and Returns to Scale in Milk Production: Effects of Price, Substitution, and Technology" Northeastern Journal of Agricultural and Resource Economics. 13(2):238-44.
6. Jeffrey, S. 1992. "Efficiency in Milk Production: A Canada-U.S. Comparison" Dept. of Rural Economy. University of Alberta, Edmonton, AB. July.
7. Matulich, S. 1978. "Efficiencies in Large-Scale Dairying: Incentives for Future Structural Change" American Journal of Agricultural Economics 60(4): 642-47.
8. Moschini, G. 1988. "The Cost Structure of Ontario Dairy Farms: A Microeconometric Analysis" Canadian Journal of Agricultural Economics 36: 187-207.
9. Mukhtar, S.M. and P.J. Dawson. 1990. "Herd Size and Unit Costs of Production in the England and Wales Dairy Sector" Journal of Agricultural Economics 41(1): 9-20.