Introduction
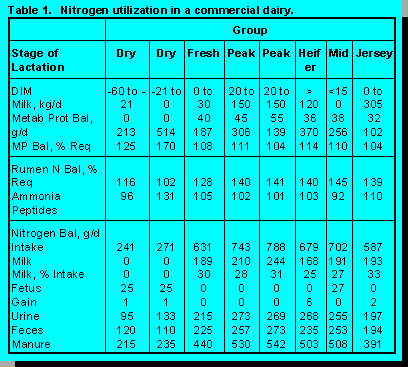 Data in Table 1 shows that only about 30% of feed N is captured in milk protein. The remaining
70% of feed N is lost as indigestible protein (feed and microbial cell walls) in feces and as urea in
urine. These data are from a well managed herd of 900 Holsteins and 100 Jerseys with an average
daily milk yield of 38 kg. For Holsteins, actual milk production is close to the formulation levels
shown in Table 1. For Jerseys, average milk production during the past 12 months was 23 to 30
kg/d. Rations provide 5 to 15% more metabolizable protein than required, but this is necessary to
meet amino acid requirements and because peak, heifer, and mid-lactation groups are fed the same
TMR. It is interesting that Jerseys are the most efficient in the capture of feed N in milk protein. In
most cases, rations are providing adequate amounts of peptides to maximize growth of bacteria
that ferment non fiber carbohydrates, but quantities of ruminal ammonia are 30 to 40% greater
than needed.
Data in Table 1 shows that only about 30% of feed N is captured in milk protein. The remaining
70% of feed N is lost as indigestible protein (feed and microbial cell walls) in feces and as urea in
urine. These data are from a well managed herd of 900 Holsteins and 100 Jerseys with an average
daily milk yield of 38 kg. For Holsteins, actual milk production is close to the formulation levels
shown in Table 1. For Jerseys, average milk production during the past 12 months was 23 to 30
kg/d. Rations provide 5 to 15% more metabolizable protein than required, but this is necessary to
meet amino acid requirements and because peak, heifer, and mid-lactation groups are fed the same
TMR. It is interesting that Jerseys are the most efficient in the capture of feed N in milk protein. In
most cases, rations are providing adequate amounts of peptides to maximize growth of bacteria
that ferment non fiber carbohydrates, but quantities of ruminal ammonia are 30 to 40% greater
than needed.The flow of N into milk versus manure can be regulated by ration formulation strategies and adjusted further by optimizing utilization of ruminal N by bacteria. Ration formulation strategies include feed ingredients used, level of non fiber carbohydrate (NFC) in rations and the level of metabolizable protein provided by rations. Utilization of N by ruminal bacteria can be affected by the efficiency of ammonia uptake by rumen bacteria and by the efficiency of bacterial growth. In addition, flow of N into milk or manure is affected by the amount of N recycled to the rumen instead of excreted in urine.
In this report, we used the Net Carbohydrate and Protein System (5,9,10,13) to examine how strategies of ration formulation and how utilization of N by ruminal bacteria affects the flow of dietary N into milk and manure. In all simulations, rations were formulated under conditions of abundant ruminal ammonia (ruminal ammonia balance not constrained) and limited, but adequate ruminal ammonia (ruminal ammonia balance constrained to 100% of requirements).
Procedure
The Net Carbohydrate and Protein Model was modified to contain a N balance sheet (4) and an optimizer (1). By using high cost dummy nutrients, the optimizer always gives a solution, even if nutrient constraints cannot be met.Rations were formulated using corn silage and alfalfa haylage as forage sources; ground corn and rumen bypass fat as sources of energy; soybean meal, corn gluten meal, blood meal, and fish meal as protein ingredients; whole cotton seed and corn distillers as additional sources of protein, energy and fiber; and soybean hulls as a source of highly fermentable fiber.
Nutrients constrained included metabolizable energy, metabolizable protein, absorbed methionine, lysine and isoleucine, ruminal peptides, NDF, NFC, and fat. Ruminal ammonia balance either was not constrained or constrained at 100% of requirements.
Dry matter (DM) intake was set at 24 kg/d for a 650 kg cow producing 45 kg milk with 3.7% fat and 3.1% milk crude protein.
Details relating to the effects of feed ingredients, digestive, and metabolic factors on N utilization by lactating dairy cattle are in Appendix Tables 1 and 2.
(Click here to view Appendix Table 1).
(Click here to view Appendix Table 2).
Results and Discussion
Ration Formulation Strategies
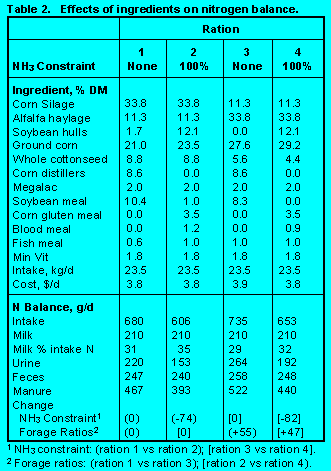 Feed Ingredient. Rations were formulated with corn silage
and alfalfa haylage at ratios of 3:1 or 1:3 with forage DM fixed at 45% (Table 2).
Rations contained constrained concentrations of NDF,
effective NDF (eNDF), NFC, and fat. Balances of absorbed methionine, lysine, and isoleucine
were 96 to 110% of requirements.
Corn silage contains more energy and less protein, especially soluble protein than alfalfa haylage. However, across both constraints of ruminal ammonia balance (none or 100%), there were only small differences in the ingredients selected. Consequently, ration crude protein (CP) was higher in rations with more alfalfa haylage. Most of the additional N consumed from rations containing more alfalfa haylage was soluble and excreted in urine. Thus, the percentage of dietary N captured as milk protein decreased.
On the other hand, constraining ruminal ammonia balance decreased the amounts of soybean meal and corn distillers selected and forced the selection of corn gluten meal and blood meal. Ration CP decreased so that less N was excreted and a greater proportion of dietary N was captured in milk.
Our simulations showed that N excretion was reduced 70 to 80 g/d (10%) by using grain forages like corn silage and alfalfa at 3:1 instead of 1:3. Constraining rumen ammonia balance reduced N excretion 70 to 80 g/d (15%). In these strategies, high bypass proteins with amino acid patterns compatible with the animal's requirements, highly digestible sources of fiber like soybean hulls and ruminally inert fats are needed to maintain optimum nutrient profiles.
Concentration of Non Fiber Carbohydrate. Rations were formulated at 36, 39, and 42% NFC (Table 3). Higher levels of NFC were achieved by replacing soybean hulls with ground corn and by reducing soybean meal. With few exceptions, nutrients were within constrained levels.
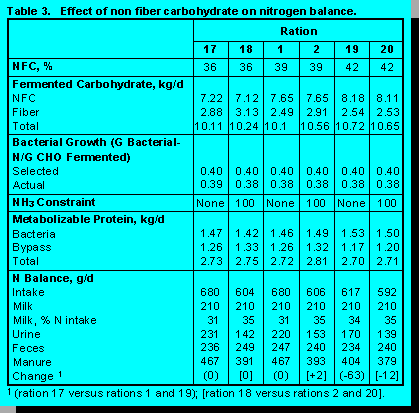
Increasing dietary NFC had interesting implications on N utilization. Because NFC replaced fermentable fiber, total fermentable carbohydrate only increased slightly so that increases in metabolizable protein provided by rumen bacteria were small. Manure N was decreased only when rations contained 42% NFC. Reductions were 63 g/d (15%) when ruminal ammonia balance was abundant, but only 12 g/d (5%) when ruminal ammonia balance was constrained. Because higher levels of NFC can increase the risk of acidosis, this strategy of reducing manure N must be applied cautiously.
Level of Metabolizable Protein. Rations were formulated to provide 95, 100, and 105% of required metabolizable protein (Table 4). Increased metabolizable protein was achieved by higher ration concentrations of CP that was more resistant to ruminal degradation. Rations formulated to provide 95% of required metabolizable protein provided inadequate amounts of absorbed lysine and isoleucine. Alleviating these deficits without increasing metabolizable protein requires rumen protected amino acids.
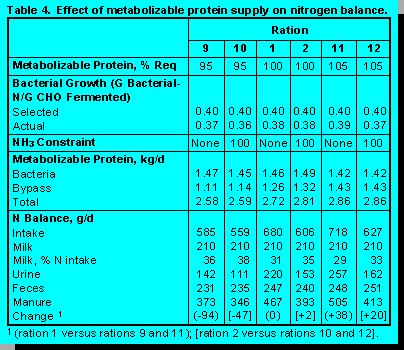
Supply of metabolizable protein had a large impact on manure N and the capture of dietary N in milk. Under conditions of unconstrained ruminal ammonia balance, decreasing metabolizable protein to 95% of requirement decreased N in feces and urine 94 g/d (20%). Increasing supply of metabolizable protein to 105% of requirement increased manure N 38 g/d (8%). Although the magnitude was not as large, similar changes were observed when ruminal ammonia balance was constrained.
Ferguson and Chalupa (3) showed that adjusting the supply of metabolizable protein above and below requirements can have greater impacts on manure N and the proportion of dietary N that appears in milk than those predicted in our simulations. Especially interesting was the observation that cows fed a ration with 15% CP supplemented with rumen protected methionine and lysine produced milk with the same concentration of casein as cows fed a ration with 19% CP.
Utilization of Nitrogen by Ruminal Bacteria
Bacteria must be provided with nitrogenous nutrients derived from dietary N degraded in the rumen and from metabolic urea recycled to the rumen. Hoover and Miller (6) summarized data that shows ruminal digestion of carbohydrates and the efficiency of bacterial growth are functions of degraded intake protein.
Efficiency of Ammonia Uptake by Rumen Bacteria. Rations were formulated with Bacterial-N/Rumen:NH3-N set at .80, .90, and 1.00 (Table 5). Overall, nutrients were within constrained ranges.
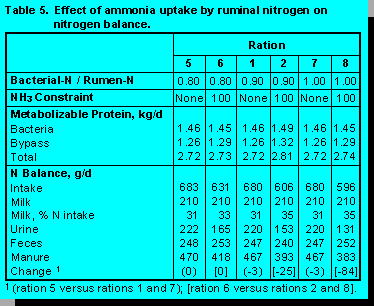
When the supply of ruminal ammonia was abundant (ammonia balance not constrained) increasing the efficiency of ammonia uptake had no impact on N intake, excretion, or capture in milk. Increasing the efficiency of ammonia uptake under conditions of limited ruminal ammonia (ammonia balance constrained to 100%) decreased manure N substantially and increased the capture of dietary N in milk. This occurred because when ruminal bacteria are more efficient in utilizing ammonia, less ruminally degraded N is needed.
Because mixed and pure cultures of rumen bacteria can scavenge ammonia from low concentration environments (11,12), NRC (8) set the efficiency at 90%. Although our simulations showed improvements in N economy when efficiency was set at 100%, revising ration formulation programs to this efficiency is not advisable because of the risk of decreasing microbial growth. On the other hand, high levels of ruminal N force lower uptake efficiencies so that excretion of dietary N in urine is increased.
Efficiency of Bacterial Growth. Efficiency of bacterial growth (g bacterial-N/kg carbohydrate fermented) was set at 35, 40, and 45 (Table 6). Again nutrients were within constrained ranges. As expected, increasing efficiency increased microbial protein yield and decreased the amount of bypass protein needed. These adjustments occurred regardless of the constraint placed on ruminal ammonia balance.
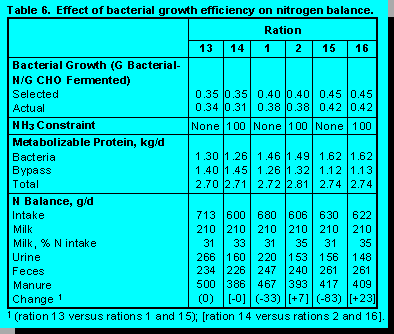
Impacts upon N utilization were interesting. Increasing bacterial growth increases the amount of dietary N that cycled through ruminal bacteria. However, cycling dietary N through ruminal bacteria incurs losses because not all bacterial N is metabolically nutritious. About 15% of bacterial N is in the form of nucleic acids which are absorbed and excreted in urine. Twenty five percent of bacterial N is in cell walls which are not digested in the intestine and appear as a fecal loss. As bacterial growth efficiency increased urine N decreased, but fecal N increased.Under conditions of abundant ruminal ammonia, the decrease in urine N excretion was greater than the increase in fecal N. This occurred because more ruminal ammonia was captured in bacteria enabling ration CP, primarily the ruminal degradable fraction, to decrease. Consequently, N intake decreased and more dietary N was captured in milk. Under conditions of limited ruminal ammonia, the decrease in urine N was less than the increase in fecal N. This occurred because although more ruminal N was required, ration CP remained constant, but the ruminally degraded fraction increased. Thus, manure N increased and a smaller proportion of dietary N was transferred to milk.
Nitrogen Recycled to the Rumen
Modelling the impact of N recycling on nitrogen utilization requires development of improved equations to describe the process.
NRC (7,8) describes N recycling as a function of N intake. However, Van Soest (15) showed that the amount of urea recycled to the rumen is relatively independent of dietary N. Rather, the amount of N recycled to the rumen depends upon the metabolic urea pool which is derived from rumen excess N and N arising from the inefficiencies of protein (amino acid) utilization, as well as N arising from metabolizable protein in excess of production requirements. Because the size of the urea pool in the body tends to be constant, excess metabolic urea is either recycled to the rumen or excreted in urine. Identification of mechanisms that control disposal of metabolic urea could allow the rumen system to be a utilizer, rather than a generator, of N.
Conclusions
Information on N utilization on a well managed commercial dairy and results of the modeling exercises revealed several key points regarding the role of lactating dairy cattle in environmental N pollution.
Additional Readings
WCDS-1995:Manure Management: Turning a Potential Environmental Problem into a Valuable Resource
Alberta Dairy Management Fact Sheet:
What Manure Can
(and can't) Tell You
References
1. ASAE Standards. 1991. Manure production and characteristics. 38Th ed. ASAE, St Joseph MI.2. Boston, R. and W. Chalupa. 1994. Unpublished Information. Univ. Pennsylvania, Kennett Square.
3. Ferguson, J.D. and W. Chalupa. 1994. J. Dairy Sci. 77(Suppl. 1):92.
4. Ferguson, J.D. W. Chalupa, C.J. Sniffen, D.G. Fox and P.J. Van Soest. 1992. J. Dairy Sci.74(Suppl. 1):175.
5. Fox, D.G., C.J. Sniffen, J.D. O'Connor, J.B. Russell and P.J. Van Soest. 1992. J. Anim. Sci.70:3578.
6. Hoover, W.H and T.K. Miller.1991. Rumen Digestive Physiology and Microbial Ecology. Page 311 in Dairy Nutrition Management. C.J. Sniffen and T. H. Herdt, ed. Veterinary Clinics of North America vol.7. W.B. Saunders Co., Philadelphia.
7. NRC. 1989. Nutrient Requirements of Dairy Cattle. 6th Edition. Natl. Acad. Sci., Washington, DC.
8. NRC. 1985. Nitrogen Usage in Ruminants. Natl. Acad. Sci., Washington, DC.
9. O' Connor, J.D., C.J. Sniffen, D.G. Fox and W. Chalupa. 1993. J. Anim. Sci. 71:1298.
10. Russell, J.B., J.D. O'Connor, D.G. Fox, P.J. Van Soest and C.J. Sniffen 1992. J. Anim. Sci. 70:3551.
11. Satter, L.D. 1980. A Metabolizable Protein System Keyed to Ruminal Ammonia Concentration-The Wisconsin system. Page 245 in Protein Requirements for Cattle. F.N. Owens, ed. Oklahoma State Univ., Stillwater.
12. Schaefer, D.M., C.L. Davis and M.P. Bryant. 1980. J. Dairy Sci. 63:1248.
13. Sniffen, C.J. J.D. O'Connor, P.J. Van Soest, D.G. Fox and J.B. Russell. 1992. J. Anim. Sci. 70:3562.
14. Tamminga, S. 1990. J. Dairy Sci. 75:345.
15. Van Soest, P.J. 1994. Nutritional Ecology of the Ruminant. Cornell Univ. Press, Ithaca.
16. USDA-SCS. 1992. Agricultural waste characteristics. Agricultural Waste Management Field Handbook. Washington, DC.