Introduction
With the possibility of freer trade in dairy products within the North American market, the future size and prosperity of the Canadian dairy industry will depend upon the ability of producers to remain competitive. Evaluations of competitiveness between countries are important to explain the future geographic structure of dairy production, but have proven difficult due to both a lack of comparable data and considerable debate over the appropriate measure. For example, in a comparison of Canadian and U.S. costs of production, Barichello and Stennes (2) cite exchange rate fluctuations, capitalization of program benefits into input prices, and interest rate differences, among others, as problematic. Richards (13) compares productivity growth rates between Alberta and Wisconsin and argues that differences in the definition of milk yield, labor market policies, and feed market distortions inevitably cloud the results.Evaluations of competitiveness between provinces are also fraught with their own problems, but are nonetheless, equally as important. With the balkanization of the Canadian fluid milk market under provincial supply management programs, the future structure of domestic production is nearly as uncertain as the continental picture. Several attempts to clarify the industry's expectations of this uncertain future document differences in either production costs between provinces (2, 10, 12) or the relationships between production efficiency and costs of production (14) . Romain and Lambert's analysis of the ways in which producers can improve efficiency and cost provides a valuable new tool for dairy policy research. This study applies their method to the Alberta fluid milk industry.
The objective of this study is to determine the relationship between production cost, herd size, milk yield, and technical efficiency in the Alberta dairy production sector. With this knowledge, producers may be provided with insights into key factors to maintaining or improving competitiveness. Policy makers will be in a better position to assess the relative importance of regional differences in production methods and individual managerial skill in the determination of inter-regional comparative advantage.
This objective is achieved through the estimation of a milk production "frontier"; that is, the statistical relationship between input use and milk yield given the assumption of efficient production. Statistical analysis is used to investigate relationships between both efficiency and production cost and a set of management-characteristic variables. These variables include herd size, input allocation ratios, milk yield, producer age, and breeding and veterinary expense. An assessment of the ability of Alberta dairy producers to improve their competitiveness through efficiency gains will help to predict the future structure of dairy production in Canada.
Canadian Dairy Efficiency
Within the context of multi-lateral US and Canadian production cost comparisons, Barichello and Stennes (2) show a sample of producers in Alberta to have a slight cost advantage over similar groups in Ontario and Quebec. Jeffrey (10) supports this conclusion and also shows Alberta producers to have an advantage over producers in neighboring prairie provinces. Both of these studies cite economies of yield and herd size as critical factors in the determination of Alberta's cost advantage, but do not account for many other cost determinants that have been shown to be equally important. As Romain and Lambert (14) demonstrate, individual producer efficiency is a critical factor in the explanation of differences in production cost among dairy producers in Quebec and Ontario. Their results show that a 10% improvement in technical efficiency can reduce cash costs by $4.10/hL in Quebec and $3.64/hL in Ontario.Several studies have examined the relationship between technical efficiency and production cost for US dairy farms (4, 5, 6, 8, 11, 16). However, little empirical evidence exists for Canadian dairy farms in general (other than Romain and Lambert) and Alberta dairy farms in particular. With similar definitions of efficiency and methods of measurement as the previous studies, the results of this study should be somewhat comparable to those from other regions.
Efficiency Defined and Measured
Efficiency means different things to different people. One form of efficiency, referred to as technical efficiency, is the ability of a producer to achieve the maximum output possible for a given set of inputs. Allocative efficiency, in contrast, refers to the producer's ability to respond to economic signals and choose optimal input combinations (i.e., proportions) given relative input prices. Overall economic efficiency is the product of technical and allocative efficiency ."Standard" estimation procedures for production functions implicitly assume that all producers are technically efficient. Any deviations from the expected output level are attributed to random events beyond the control of the producer. The concept of a production "frontier", however, allows the additional possibility of inefficient input use leading to deviations from the frontier production level. Extending this idea to economic behavior, it is possible that some producers do not respond to input prices in an optimal manner in that they do not use cost-minimizing combinations of inputs (i.e., allocatively inefficient). It is on these premises that the discussion in this paper is based.
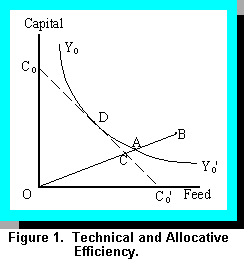 The concepts of technical and allocative efficiency, and their measurement, may be depicted
graphically. In Figure 1, the curve Y0Y0' represents efficient combinations of two inputs, feed and
capital, in producing output level Y0 (i.e., the efficient isoquant). The line C0C0' represents input
combinations (i.e., combinations of feed and capital) having an aggregate cost of C0 (i.e., an
iso-cost line). The efficient isoquant represents the production "frontier"; all points on Y0Y0' are
technically efficient. Point D on the efficient isoquant is also allocatively efficient as it represents
the least-cost feasible combination of capital and feed needed to produce Y0. Being both
allocatively and technically efficient, point D is also termed the point of economically efficient
production.
Suppose that point B represents an observed combination of inputs used to product Y0. At this point, production is neither technically or allocatively efficient. The degree of technical inefficiency for this producer is given by the ration OB/OA; that is, the ratio of the distance between potential (i.e., efficient) and actual input use. The degree of allocative inefficiency for this producer is given by the ratio OA/OC; that is, the distance between the isoquant and iso-cost line, given the observed input ratio.
It is clear from Figure 1 that technical efficiency does not necessarily imply overall economic efficiency, nor does it imply cost minimization. A farm may achieve technical efficiency by employing inputs without regard to their price. Despite a relatively high level of production, a producer that follows this strategy will not likely minimize cost.
Empirical measurement of technical efficiency typically involves the specification and estimation of a frontier production function. Several approaches have been used to estimate frontier functions. Some studies have used mathematical programming models to assess technical efficiency. For example, Weersink et al. (17) use linear programming to assess efficiency for Ontario dairy farms. They separate technical inefficiency into components representative of "congestion" inefficiencies and scale inefficiencies. Congestion inefficiency arises when an input is overused such that its marginal productivity becomes negative. The results suggest a high level of efficiency among Ontario dairy farms - an average technical efficiency level of 94.9%, an average congestion efficiency level of 99.8%, and a scale efficiency average of 96.8%. Fully 45% of the sample is shown to be 100% efficient overall.
Other studies have used statistical models (i.e., econometrics) to estimate frontier production functions, from which measures of technical efficiency are made. Bravo-Ureta and Rieger (6), for example, use econometric models to find a best-practice frontier among a sample of New England dairy farms. They also derive a cost function in order to assess allocative efficiency. The results show very little difference between the average technical efficiency level (83%) and the average allocative efficiency ratios (84.6%).
In order to maintain comparability to the recent study of Ontario and Quebec dairy efficiency by Romain and Lambert (14), estimates of the Alberta production frontiers in the current study are estimated using their iterative "average frontier" method. In this approach, estimates of a production function relate milk output to various input levels in order to provide a measure of the "average" attainable production over all producers. Exclusion of those observations that fall below this average level prior to the reestimation of the production function provides estimates of the most efficient, average production function. Repetition of this process until further estimation is no longer possible leads to a "frontier" production function that describes the average best practice technology of the most efficient producers.
Methods and Data
A milk production frontier is estimated for Alberta dairy producers, using the iterative average frontier procedure. The specification chosen for this study models quantity of milk produced as a function of productive inputs, as follows:
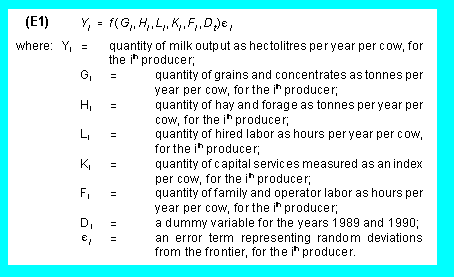
The specific functional form for the production frontier is presented in the Appendix. From the estimate of the production frontier, technical efficiency ratios are calculated for each producer. This ratio, similar to that illustrated in Figure 1 earlier, is structured in such a way that a value of 1 or 100% represents technically efficient production.
To achieve the objective of explaining inter-farm variations in production cost, the relationships between milk yield, herd size, producer age, a proxy for genetic quality (annual expenditures for breeding and veterinary care), and production cost are estimated using an empirical "cost equation". Because the effect of yield and herd size on production cost is felt to be non-linear, these variables are specified as quadratics.
The parameter estimates from this model provide an indication of the optimal yield and herd size. If actual herd sizes and yields are below the "optimal" level, then this suggests that there are unexploited economies of scale in the Alberta dairy industry. The specific cost equation modelled in this study is structured as follows:
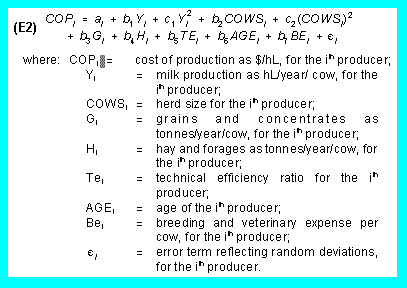
The results from this estimation procedure are used to examine factors influencing costs of milk production in Alberta.
The data for this study are from the Alberta Agriculture-Alberta Milk Producers' Society annual cost of production surveys from 1989-1991. The sample consists of an unbalanced panel of 55 Alberta fluid milk producers chosen as representative of each region and herd size group. Participation in the survey is entirely voluntary and each producer typically participates for four consecutive years. The total sample size is 181 pooled observations.
Total cost is defined on a dairy enterprise basis. As a result, all costs incurred in raising calves to milking age are included. For the cost equation, the dependent variable is defined as total production costs; that is, the total, per hL cost of operation including capital costs such as interest, depreciation, and a return to equity. A more detailed description of the cost definitions and survey method is provided by Susko (15).
Output consists of the total amount of milk shipped from the farm to both the fluid and industrial markets, in hL per year. Although the producers in the Alberta Agriculture survey are largely fluid milk producers, all must hold some industrial (market sharing) quota in order to sell milk produced in excess of their utilized fluid allocation. Because milk shipments go to both markets, the price is a net, or blended price per hL.
Variable production inputs include hours of hired labor, tonnes of grain and concentrates, and tonnes of forage. Forage is defined as the sum of hay, silage, and pasture consumption. Total feed expenditure divided by the tonnage fed gives the average price per tonne of feed. Some producers buy their feed, while others produce most feed requirements on their farms. Expenditures for homegrown feed are calculated using regional average rates. Prices and quantities for grain and concentrates are found in a similar way. Wages for hired labor are the hourly rates actually paid by the producer. Due to a lack of worker training or experience data, the wage is unadjusted for quality.
 Several inputs are classified as being fixed. This includes capital and family/ operator labor. In
this classification, the cost of production survey reports annual herd size, value of capital stock,
amount of family labor, and quota holdings. Family wage rates are calculated by dividing the total
family wage bill by the hours worked, but there is insufficient information to adjust the wage for
unskilled or child labor. Capital consists of the value of buildings and equipment specific to the
dairy enterprise. Ball's (1) method is used to provide an annual capital rental price series. The
rental price is then used to derive an annual level of capital use from reported stock values.
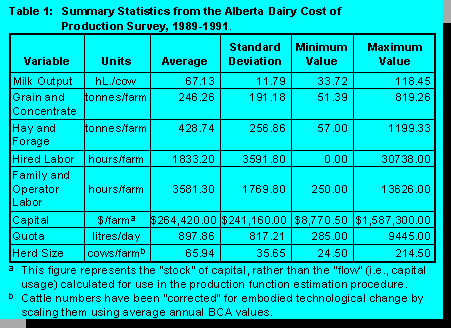
For estimation purposes, a correction for embodied technological (genetic) improvement in cattle produces an annual series of equivalent-cattle livestock inputs. The pace of genetic progress in dairy cows has been so rapid as to render cattle from two different vintages two qualitatively different inputs. The index used consists of the provincial average breed class average (BCA) for Holstein cattle. Although it is preferable to use an index independent of actual milking performance, this index is the best available for the sample period. Howard and Shumway's (9) method is used to construct a rental price series for cattle. Table 1 provides summary statistics for each of the variables described above.
Results and Discussion
The frontier production function, estimated using survey data for Alberta milk producers, is presented in the Appendix (Table A.1). (Click here to view Appendix Table A.1). This frontier serves as a benchmark describing the relationship between input use and milk production for the most technically efficient producers in the sample. Using observed input-output combinations, inefficiency ratios for all farms are calculated with reference to this frontier. Because the frontier consists of an average of the 21 most efficient firms, the range of efficiency ratios extends beyond 1.00 or 100%. In fact, technical efficiency ratios of the most efficient farms range from a low of 55.5% to a high of 111.4%. The average efficiency ratio is 86.4% with a standard deviation of 11.9%.While interprovincial comparisons of these inefficiency ratios cannot be used to suggest that one group is more or less efficient than any other, the Alberta results indicate that 10.3% of the sample farms are 100% efficient . This compares to Romain and Lambert's estimates of 2.3% in Quebec and 9.4% in Ontario. In addition, 95% of Alberta producers are between 62% and 110% efficient.
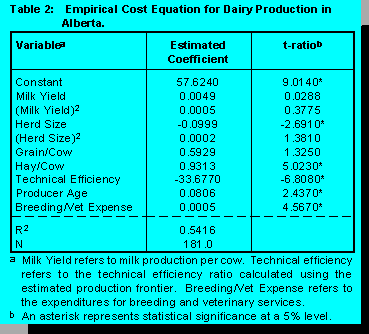 Perhaps more interesting are comparisons between the effects of efficiency, and other variables, on
the cost of production. As noted in the previous section, this study uses a regression model to
estimate the relationship between herd size, milk yield, feed usage, technical efficiency, operator
age, veterinary and breeding expense, and cost of production. Comparing these results to those of
Romain and Lambert reveals aspects of the structure of dairy production that are similar between
the two regions, and some that are markedly different. The results of this analysis for the Alberta
dairy producers are shown in Table 2.
The effects of herd size on costs of production suggest that there are significant herd size economies to be exploited by Alberta producers. This result is somewhat in agreement with Romain and Lambert's estimates. They show that cash costs fall with increased herd size in Ontario, but that production costs in Quebec do not vary significantly with herd size. The Alberta results in Table 2 show that production costs fall by $0.053 for every cow. This is potentially significant, although less than the $0.127 shown for Ontario producers by Romain and Lambert.
A priori, both yield and herd size should have a non-linear effect on costs - total cost per litre should fall over some very low range of production, reach some minimum, and then rise when capacity and other constraints are met. As a formal test of such U-shaped costs, these results show that a quadratic specification for herd size provides a better description of Alberta production costs than does the linear version. Romain and Lambert suggest that costs increase rapidly beyond a 40 cow threshold in Quebec. The current analysis shows the optimal herd size in Alberta to be 206 head. Since the average herd size in this sample is 66 head, there would appear to be an opportunity to lower average costs of production through the exploitation of size economies.
The existence of herd size economies found in this study is consistent with the conclusions drawn from previous research in other geographic regions. Weersink et al. (17) report that every 1% increase in herd size yields a 5% increase in efficiency for Ontario dairy farmers. This is presumably only valid over a small range of possible herd sizes. Tauer (16), in a sample of New York dairy farms, shows that each cow adds 1% to the short-run technical efficiency of milk production. Bravo-Ureta and Rieger (6) add to the weight of evidence in support of a positive effect on efficiency from increased herd size using a sample of New England dairy farms.
In contrast to the herd size effect, milk yield per cow does not appear to have a significant effect on costs of production for Alberta producers. This differs from the positive relationship between yield and cost found by Romain and Lambert for both Ontario and Quebec. This result also contradicts the findings of Barichello and Stennes (2) who conclude that Canadian dairy competitiveness can be improved through higher milk yields. Given herds of similar size, efficiency, and feed use, yield information adds nothing to the determination of production costs. In fact, there is no reason why high yields should necessarily imply lower costs - the high yields may often be achieved only with a very high feed, labor, and veterinary expense.
Some of the other explanatory variables in the cost equation also affect costs of production. Increases in concentrate use per cow are marginally insignificant in terms of their effect on costs of production, while hay and forage use significantly raises costs. This result may capture the effect of attempts to produce "cheap milk" through grazing cattle and feeding inferior qualities of hay instead of grain and concentrates. When the lower yield is factored in, this does not appear to be a low-cost strategy. Older producers in Alberta also tend to have higher production costs than do younger producers. This may suggest that new entrants to the industry are more likely to adopt cost reducing technologies than are incumbent producers. Production costs also increase directly with the amount of expenditure on breeding and veterinary services. This variable was intended to capture producers' investment in genetic advancement. However, it is clear that herds with health or reproduction problems dominate the expected effect.
Finally, as Romain and Lambert found for both Ontario and Quebec, improvements in technical efficiency tend to reduce costs. In fact, every 10% increase in the efficiency ratio causes production costs to fall by $3.38 per hL, compared to $5.25 in Quebec, and $4.84 in Ontario. Romain and Lambert also report the results of a regression analysis using a similar set of variables to explain technical efficiency. They find that larger farms are more technically efficient in both Quebec and Ontario, although the relationship for Ontario is not statistically significant. For Alberta milk production, technical efficiency can be expected to fall by 0.6% for every one cow increase in herd size among producers of the same age, veterinary and breeding expense, and milk yield. This result suggests that simply increasing the average herd size to the optimal level above is not enough to achieve lower production costs in Alberta - changing the size structure within the industry must be accompanied by a "better" use of all production inputs.
Conclusions
Any reallocation of dairy production that would accompany changes to the current market sharing system in Canada would be influenced by relative production costs in different regions. While several studies have shown that Alberta producers currently enjoy a cost advantage over other Canadian producers, little knowledge exists as to how the regional structure of costs would change if producers' decisions were more focused on the attainment of a regional comparative advantage. Many now believe that unexploited economies exist in both milk yield and herd size in all provinces. Without significant interprovincial competition, however, it is likely that these opportunities differ widely between provinces.This paper examines factors contributing to costs of production for dairy producers in Alberta. These are compared to a similar analysis of Quebec and Ontario dairy production by Romain and Lambert (14). Results from each region differ sharply with respect to the ability of producers to reduce costs through increased yields. Whereas in Alberta the minimum-cost yield is marginally above current levels, Romain and Lambert show that costs rise with milk yield in Ontario and Quebec. Greater reductions in cost can be achieved through efficiency improvements.
The study results suggest that there are significant economies of herd size that may be exploited by Alberta milk producers. This contrasts with Romain and Lambert's results for Quebec, where production costs do not appear to fall with herd size. Their results for Ontario dairy production suggest significant opportunities to lower costs through expansion. In this respect, Alberta dairy producers are more like those in Ontario in that the optimal herd size (206 head) is over three times the current average herd size. Herd sizes are increasing rapidly throughout Canada, but a forced rationalization of the industry may accelerate this process.
This research contains several implications for the future of the Canadian dairy sector. First, improvements in managerial ability (i.e., efficiency) appear to be one clear way to improve competitiveness. On a interregional basis, however, it appears as though dairy producers in Ontario and Alberta have a greater opportunity to become competitive than their Quebec counterparts. Given the disproportionate size of the Quebec dairy industry, these results suggest that freer trade within Canada may force a massive reorganization of the dairy industry.
Notes
Appendix:
Empirical Milk Production Frontier for Alberta Dairy ProducersA transcendental production function for milk production in Alberta is estimated in this study. The inputs used in the estimation procedure include hay, concentrates, labor, and capital equipment. This specification is chosen to maintain some consistency with the study by Romain and Lambert (14). The specific functional form used for the frontier production function is as follows:
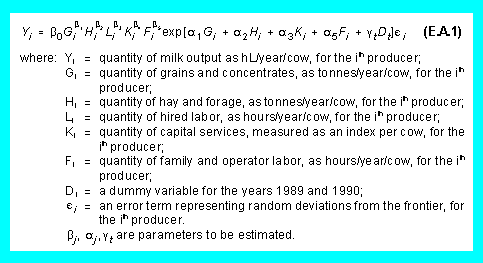
Equation A.1 is estimated using Ordinary Least Squares. The first iterative estimation provides a "standard" average production function. Inefficient producers are eliminated from the sample, and the estimation procedure is repeated to obtain the frontier production function. Beyond four iterations the sample size became too small to obtain further estimates. Table A.1 shows the results from both the initial and final estimation stages.
Individual parameters in the final iteration of the frontier show only the constant term, grain and family labor to be significant in linear form, while the log of hay, grain, and hired labor are significant at the 5% level. Exclusion of technically inefficient producers causes the explanatory ability of the model to rise from an initial 81.54% of total variation explained to over 99% in the final round. However, because the number of observations in the final round is only 21 farms, the stability of these parameter estimates is subject to some question. Nonetheless, this frontier serves as the benchmark that describes the most technically efficient dairy farms in the sample.
(Click here to view Appendix Table A.1).
Additional Readings
Applied Dairy Science Course - University of Alberta:Economics of Dairy Production
References
1. Ball, V. E. 1985. "Output, Input, and Productivity Measurement in U.S. Agriculture, 1948-79". American Journal of Agricultural Economics. 67:475-486.2. Barichello, R. and B. Stennes. 1994. "Cost Competitiveness of the Canadian Dairy Industry: A Farm Level Analysis", in Supply Management in Transition Towards the 21st Century". Proceedings of Conference Held at McGill University, Ste. Anne de Bellevue, Quebec. June.
3. Battese, G.E. 1992. "Frontier Production Functions and Technical Efficiency: A Survey of Empirical Applications in Agricultural Economics". Agricultural Economics. 7:185-208.
4. Bravo-Ureta, B.E. 1986. "Technical Efficiency Measures for Dairy Farms Based on a Probabilistic Frontier Function Model". Canadian Journal of Agricultural Economics. 34:399-415.
5. Bravo-Ureta, B.E. and L. Rieger. 1990. "Alternative Production Frontier Methodologies and Dairy Farm Efficiency". Journal of Agricultural Economics. 41:215-226.
6. Bravo-Ureta, B.E. and L. Rieger. 1991. "Dairy Farm Efficiency Measurement Using Stochastic Frontiers and Neoclassical Duality". American Journal of Agricultural Economics. 73:421-428.
7. Farrell, M.J. 1957. "The Measurement of Production Efficiency". Journal of the Royal Statistical Society. Ser. A. 120:253-81.
8. Grisley, W. and J. Mascarenhas. 1985. "Operating Cost Efficiency on Pennsylvania Dairy Farms". Northeastern Journal of Agricultural and Resource Economics. 14:88-95.
9. Howard, W. H. and C. R. Shumway. 1988. "Dynamic Adjustment in the U.S. Dairy Industry". American Journal of Agricultural Economics. 70:837-847.
10. Jeffrey, S.R. 1994. "Costs of Milk Production: A Canada-U.S. Comparison." Advances in Dairy Technology. Volume 6. Proceedings of the 1994 Western Canadian Dairy Seminar. published by the Department of Dairy Science, University of Alberta.
11. Kumbhakar, S.C., B. Biswas and D.V. Bailey. 1989. "A Study of the Economic Efficiency of Utah Dairy Farmers: A System Approach". Review of Economics and Statistics. 71:595-604.
12. National Dairy Policy Task Force. 1991. Growing Together: A Comparison of the Canadian and U.S. Dairy Industries. Price-Waterhouse. Ottawa.
13. Richards, T.J. 1994. "Competitive Advantage in North American Dairy Production", in Supply Management in Transition Towards the 21st Century". Proceedings of Conference Held at McGill University, Ste. Anne de Bellevue, Quebec. June.
14. Romain, R. and R. Lambert. 1994. "Situation Competitive de la Filiere Laitiere Canadienne", in Supply Management in Transition Towards the 21st Century". Proceedings of Conference Held at McGill University, Ste. Anne de Bellevue, Quebec. June.
15. Susko, R. 1992. "The Economics of Dairy Production in Alberta". Alberta Agriculture, Production Branch, Edmonton, Alberta.
16. Tauer, L.W. 1993. "Short-Run and Long-Run Efficiencies of New York Dairy Farms". Agricultural and Resource Economics Review. 22:1-9.
17. Weersink, A., C.G. Turvey, and A. Godah. 1990. "Decomposition Measures of Technical Efficiency for Ontario Dairy Farms". Canadian Journal of Agricultural Economics. 38:439-456.